Trade
Trading Type
Spot
Trade crypto freely
Alpha
Points
Get promising tokens in streamlined on-chain trading
Pre-Market
Trade new tokens before they are officially listed
Margin
Magnify your profit with leverage
Convert & Block Trading
0 Fees
Trade any size with no fees and no slippage
Leveraged Tokens
Get exposure to leveraged positions simply
Futures
Futures
Hundreds of contracts settled in USDT or BTC
Options
HOT
Trade European-style vanilla options
Unified Account
Maximize your capital efficiency
Demo Trading
Futures Kickoff
Get prepared for your futures trading
Futures Events
Participate in events to win generous rewards
Demo Trading
Use virtual funds to experience risk-free trading
Earn
Launch
Investment
Simple Earn
VIP
Earn interests with idle tokens
Auto-Invest
Auto-invest on a regular basis
Dual Investment
Buy low and sell high to take profits from price fluctuations
Quant Fund
VIP
Top asset management team helps you profit without hassle
Crypto Loan
0 Fees
Pledge one crypto to borrow another
Lending Center
One-Stop Lending Hub
VIP Wealth Hub
New
Customized wealth management empowers your assets growth
Private Wealth Management
Customized asset management to grow your digital assets
Staking
Stake cryptos to earn in PoS products
BTC Staking
HOT
Stake BTC and earn 10% APR
GUSD Minting
New
Use USDT/USDC to mint GUSD for treasury-level yields
Soft Staking
Earn rewards with flexible staking
More


Tulip颜溪
No content yet
Tulip颜溪
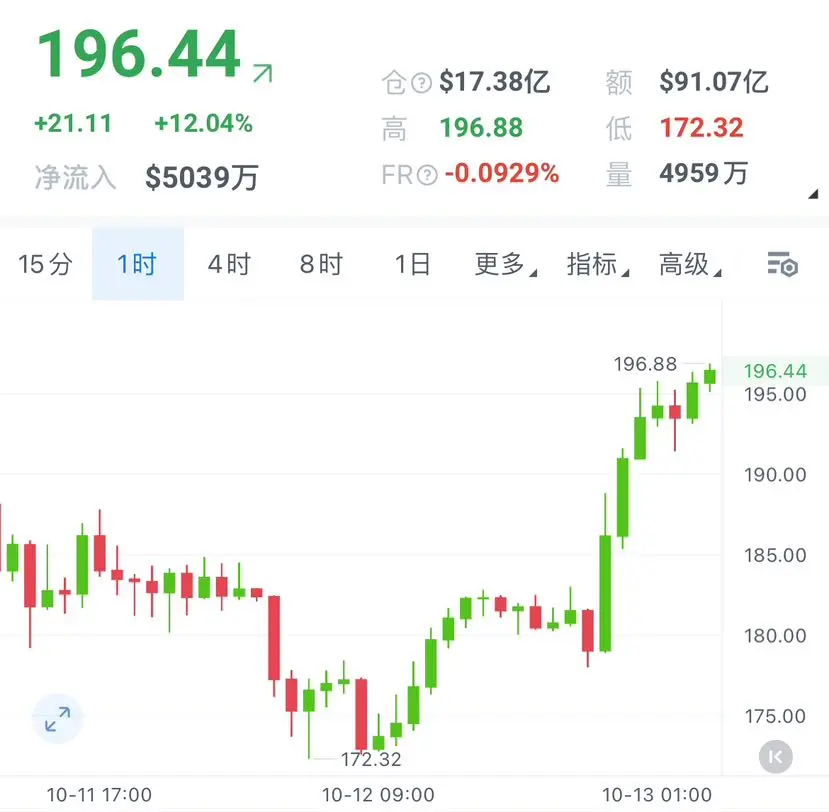
It is recommended to short in the 197-200 area for SOL, with a target looking down towards the 185-170 area.
When operating, please be sure to set reasonable stop-loss levels based on your own position and effectively implement risk control.
When operating, please be sure to set reasonable stop-loss levels based on your own position and effectively implement risk control.
SOL9.01%
- Reward
- like
- Comment
- Repost
- Share
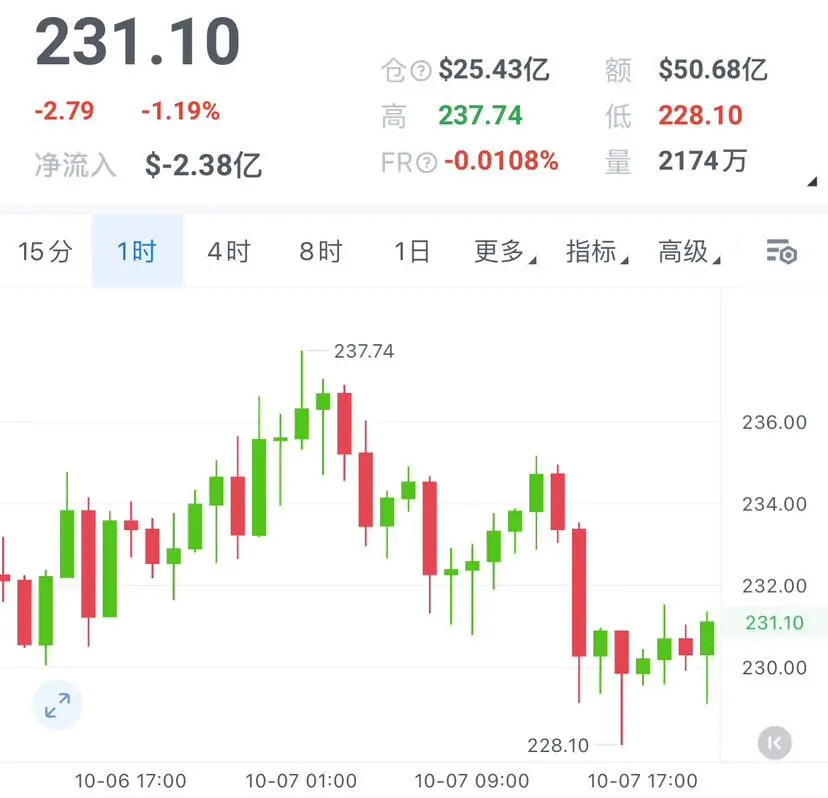
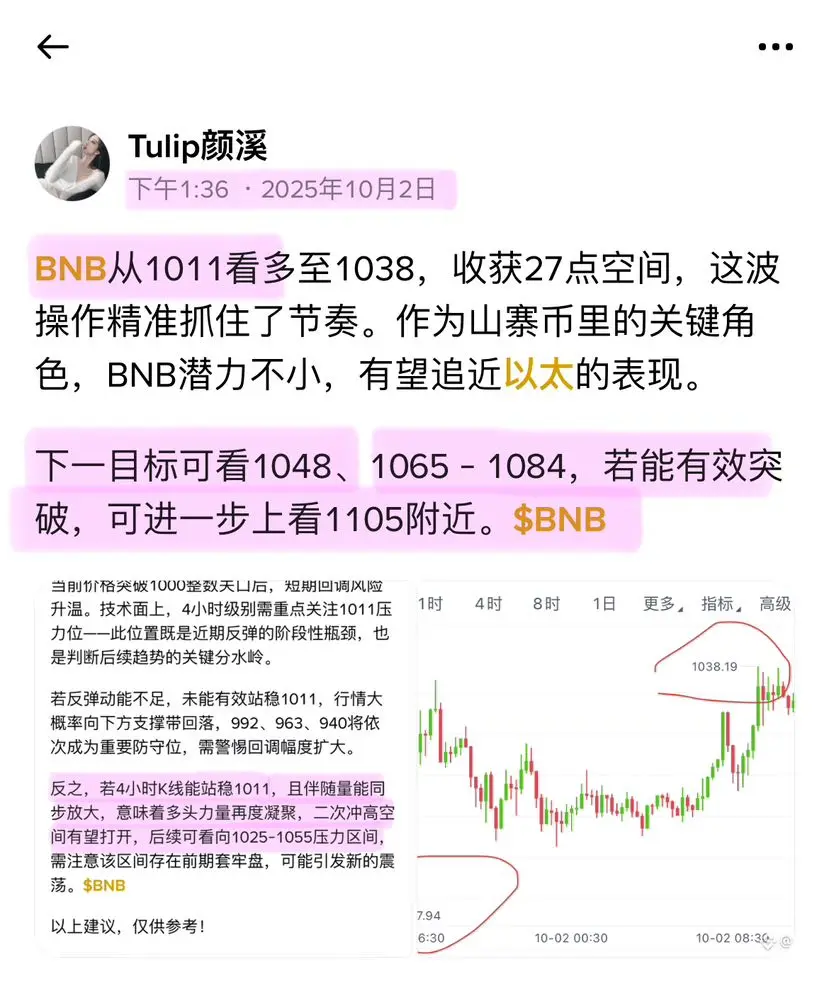
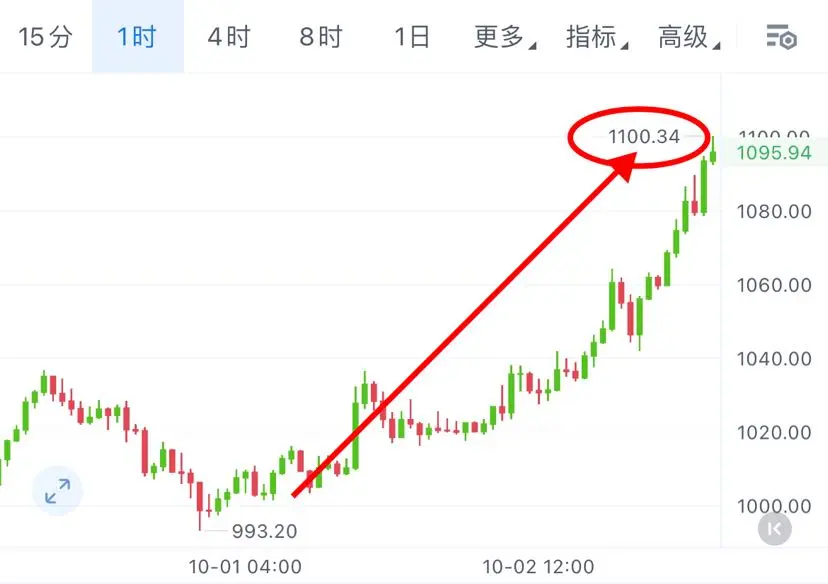
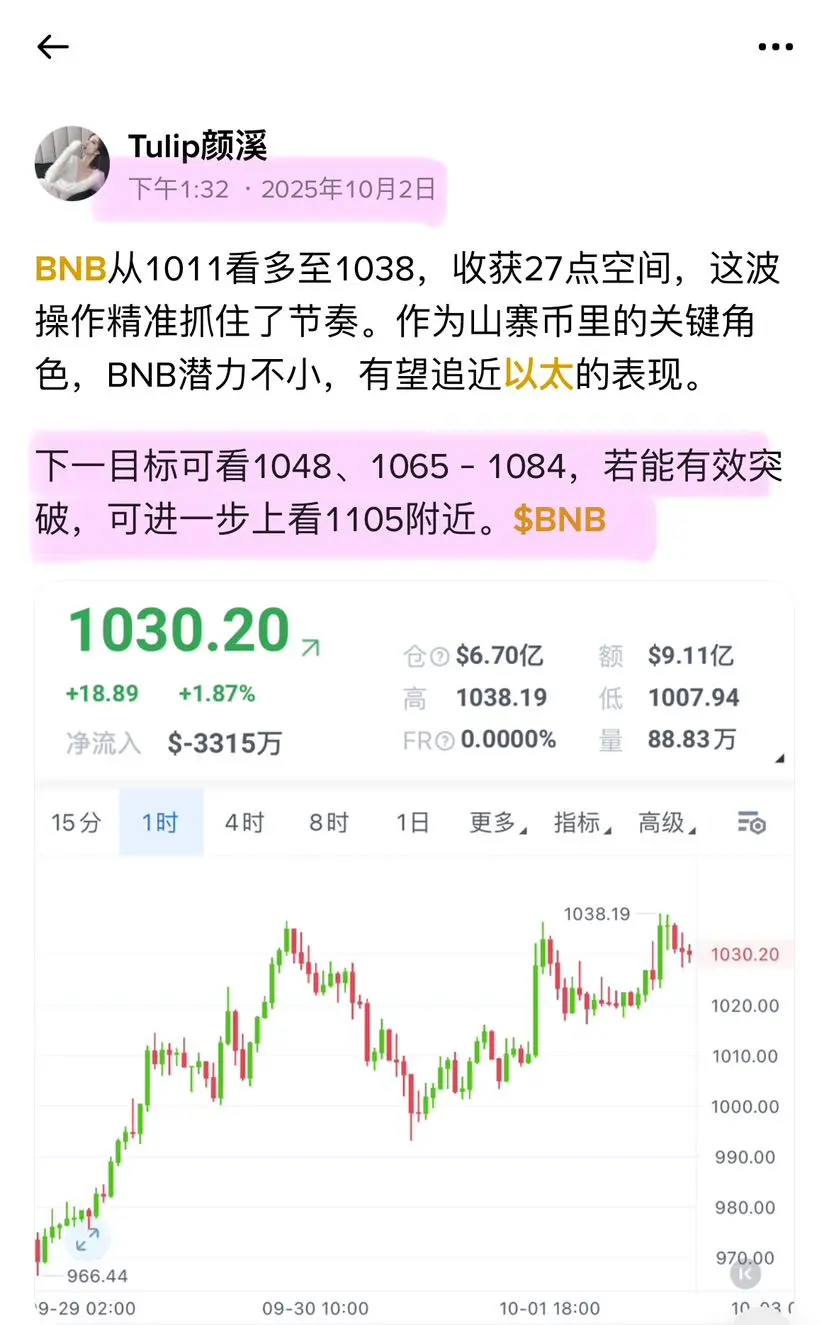

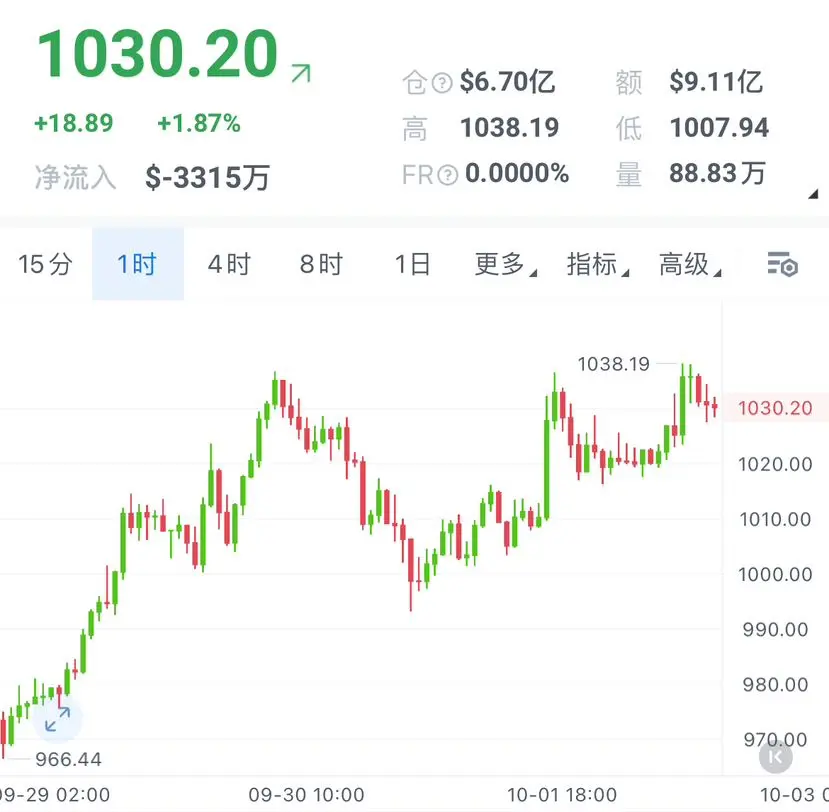
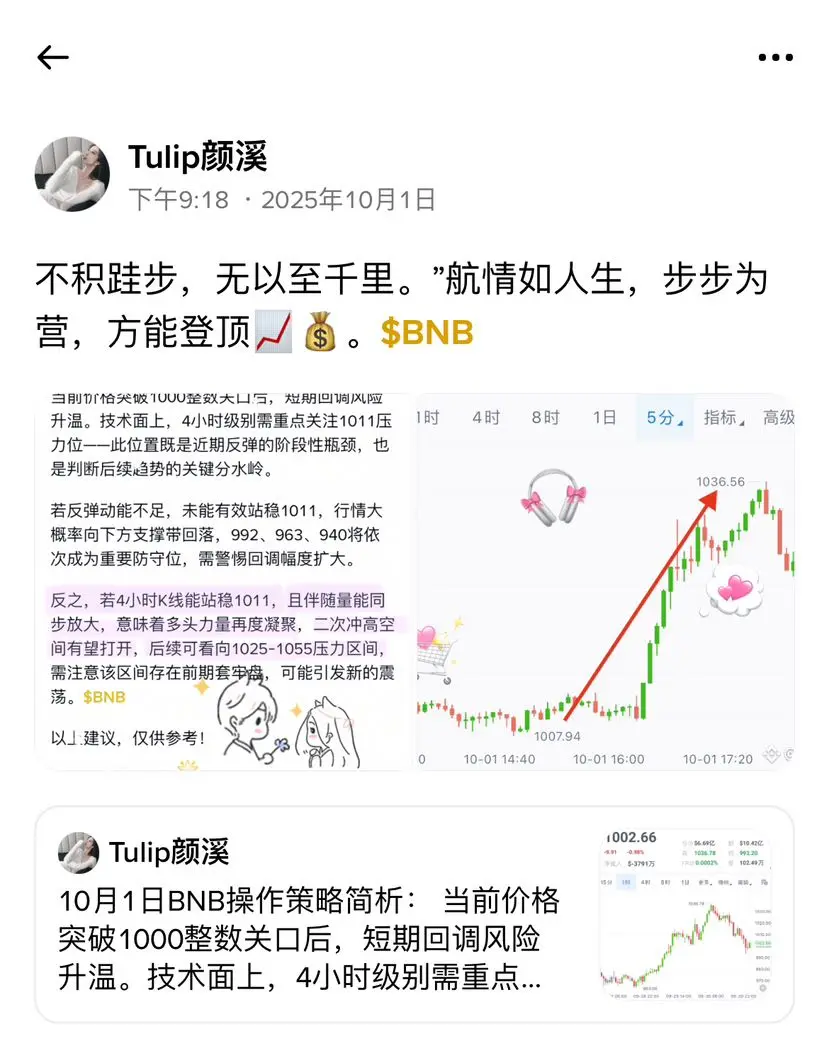
BNB rose from 1011 to 1038, gaining 27 points of space, and this operation accurately captured the rhythm. As a key player in the alts, BNB has considerable potential and is expected to approach Ether's performance.
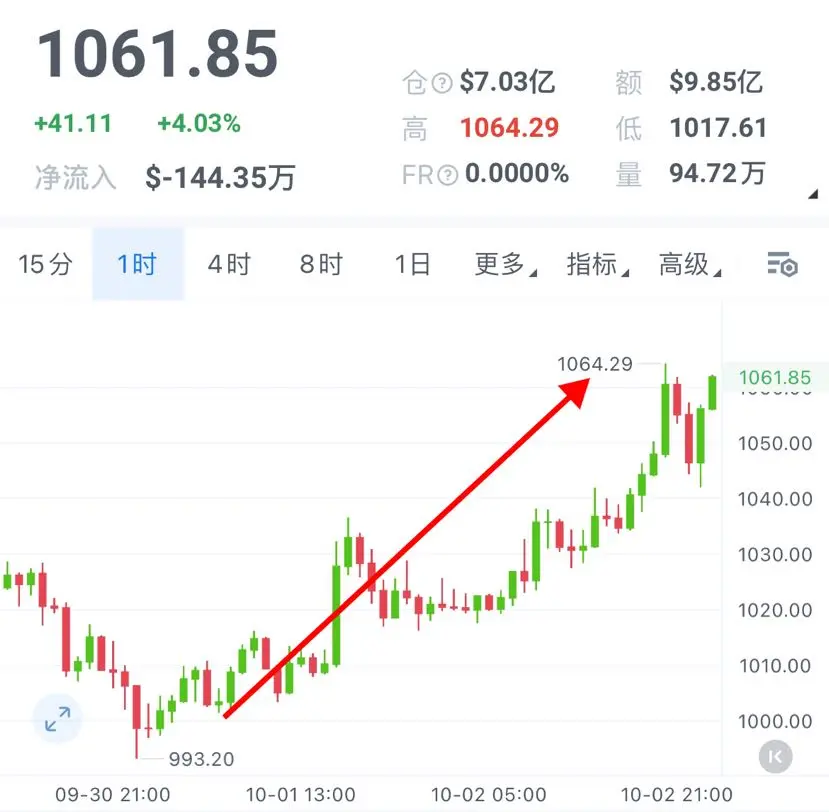
The next targets are 1048, 1065 - 1084. If they can effectively break through, we can further look towards around 1105.
The next targets are 1048, 1065 - 1084. If they can effectively break through, we can further look towards around 1105.
BNB16.92%
- Reward
- like
- Comment
- Repost
- Share
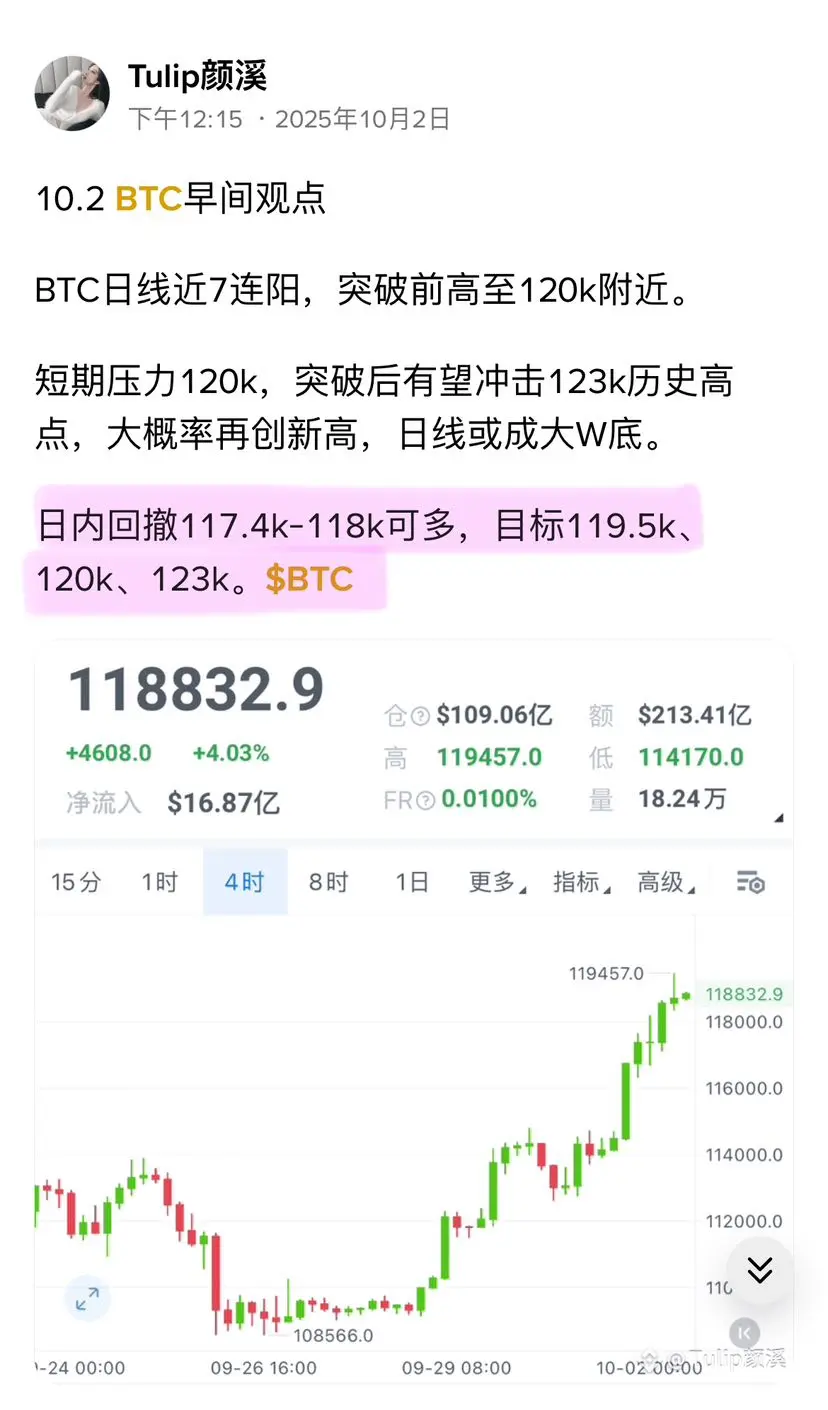
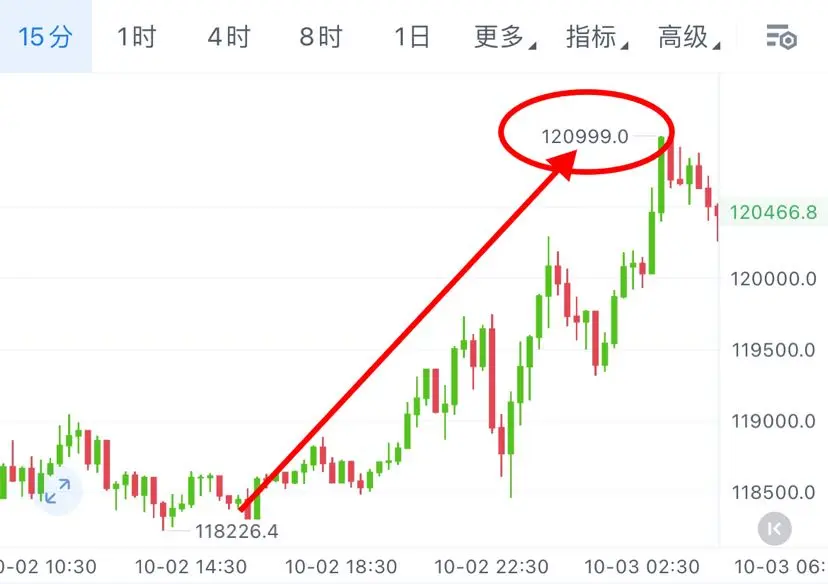
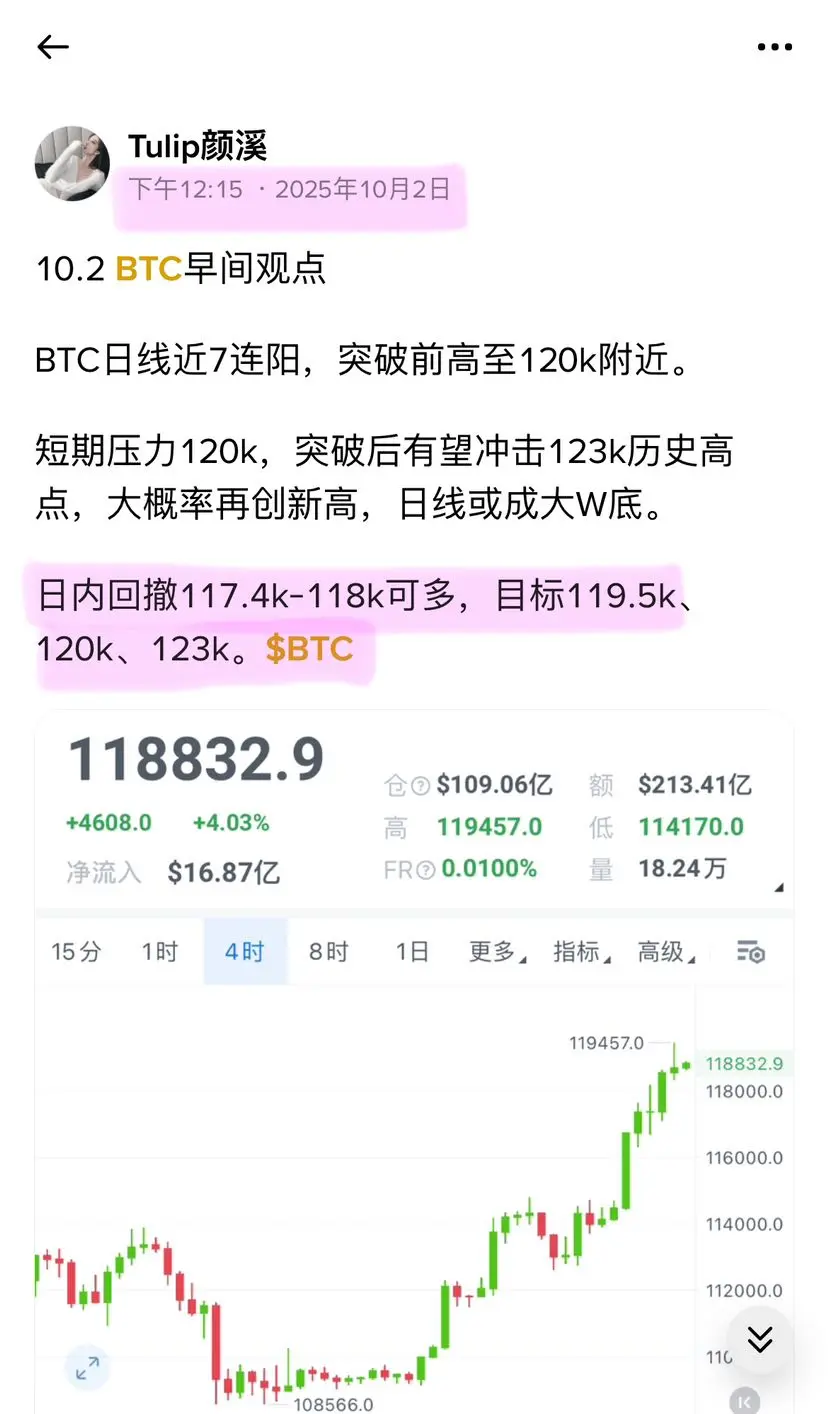
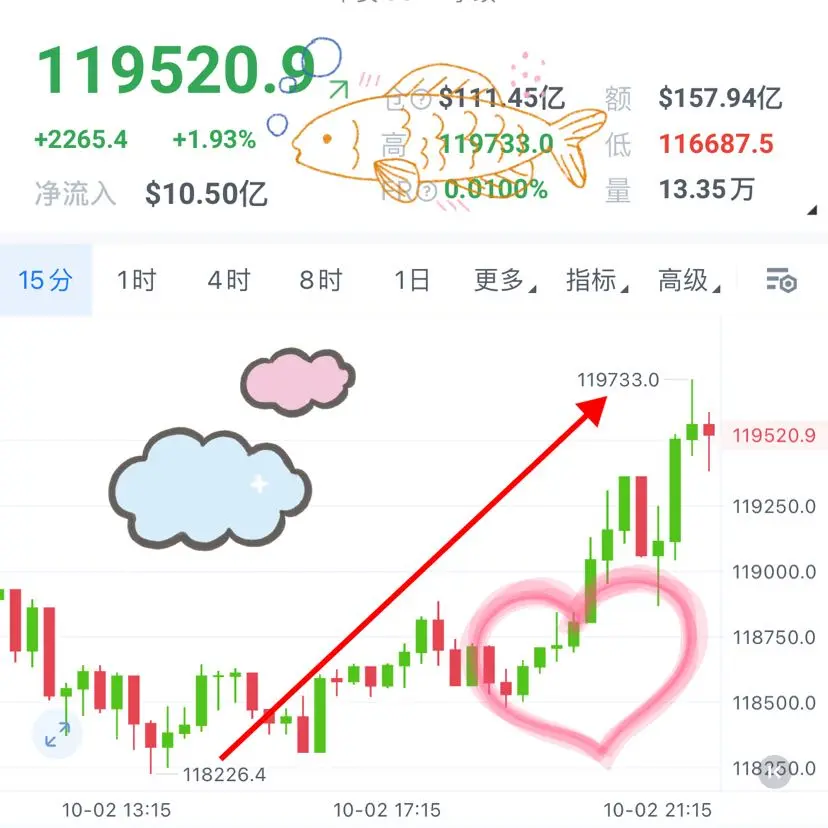
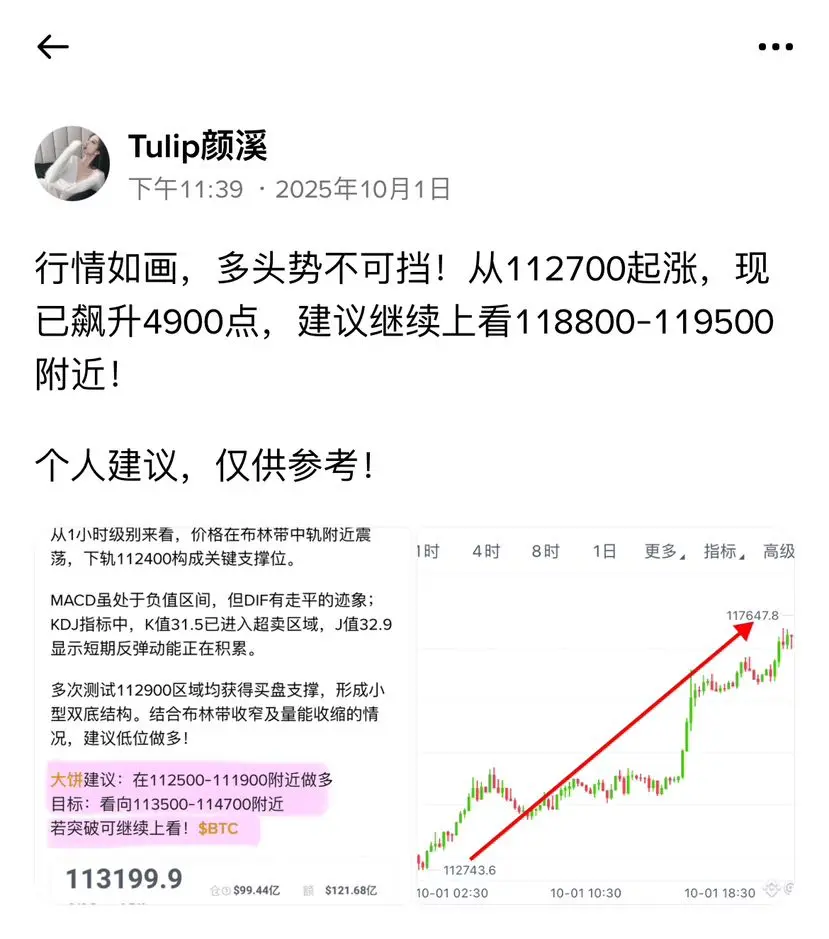
10.2 BTC Morning Insights
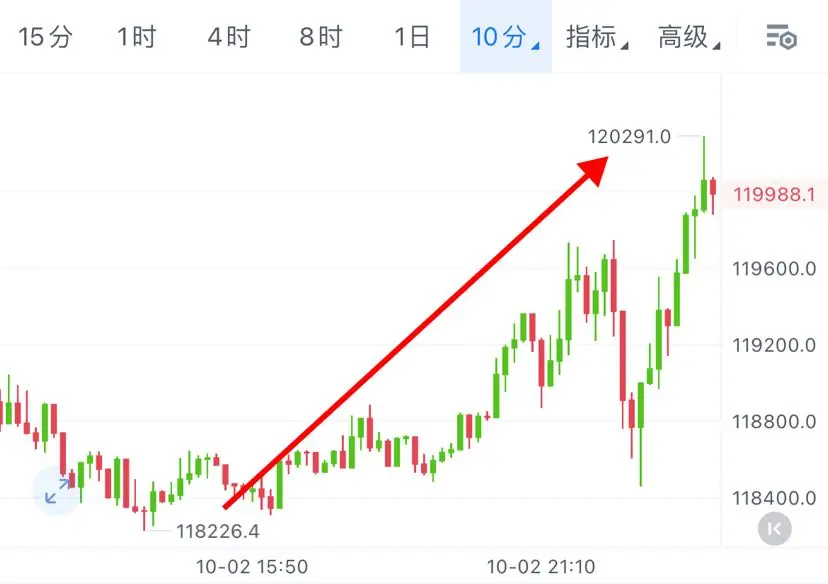
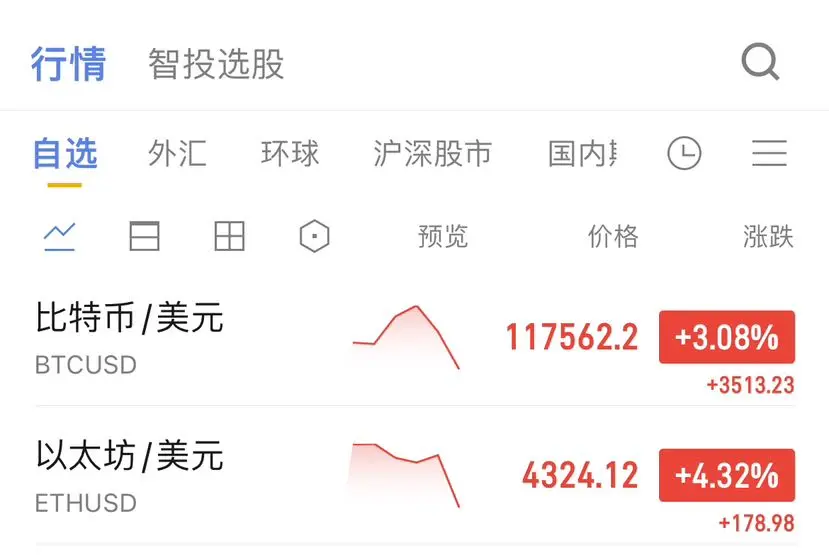
BTC has seen nearly 7 consecutive daily gains, breaking through the previous high to around 120k.
Short-term pressure at 120k, after breaking through, it is expected to challenge the historical high of 123k, with a high probability of setting a new high, and the daily chart may form a large W bottom.
A pullback within the day to 117.4k-118k can be bought, with targets at 119.5k, 120k, and 123k.
BTC3.47%
- Reward
- like
- Comment
- Repost
- Share
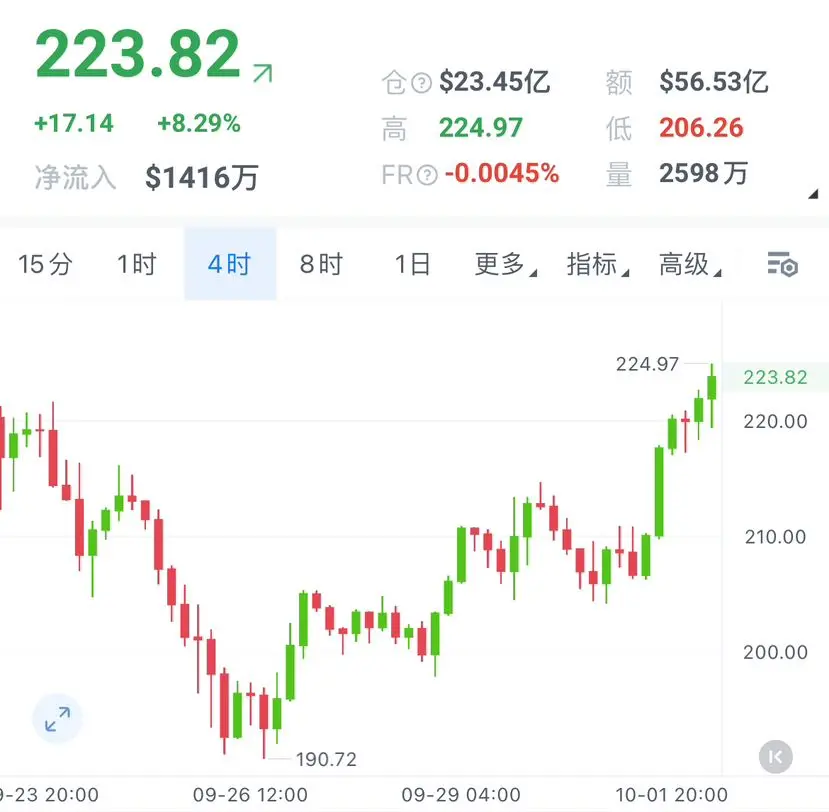
Identify your weaknesses, continuously review and correct, and make up for shortcomings; your account performance will naturally improve steadily. The environment is created by the mind, and success is in human hands. Walk steadily on the path beneath your feet, and there will always be rewards. Good afternoon, let's keep fighting together!
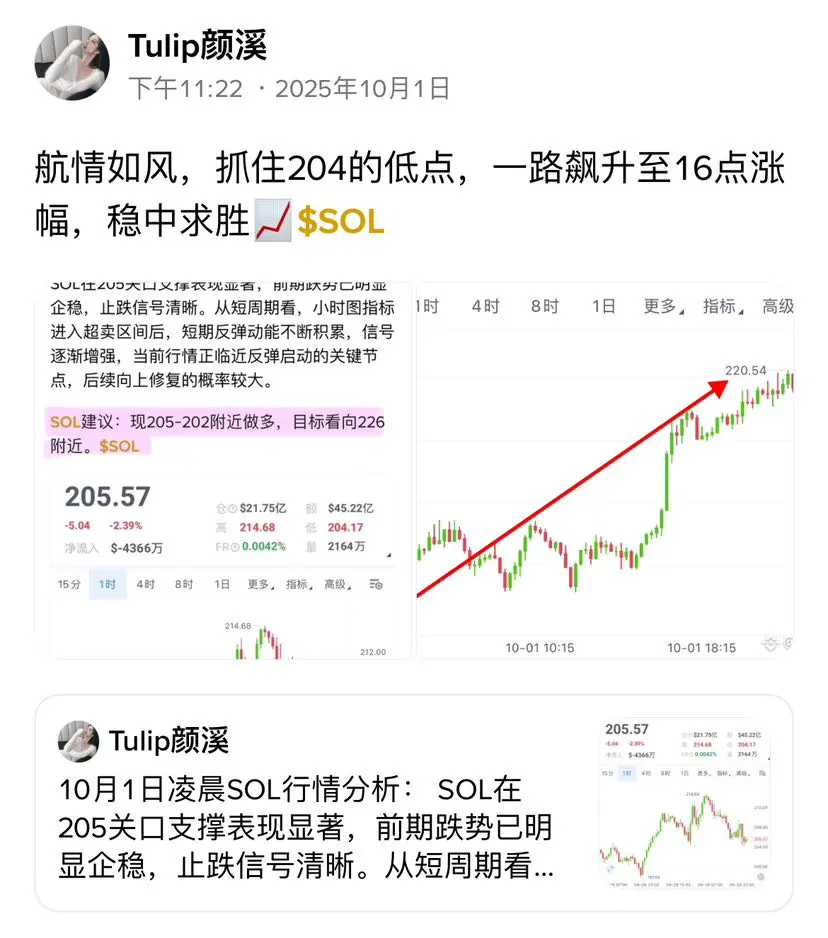
Afternoon SOL suggestion: Buy around 215-220, target towards 230 and 246.
Afternoon SOL suggestion: Buy around 215-220, target towards 230 and 246.
SOL9.01%
- Reward
- like
- Comment
- Repost
- Share
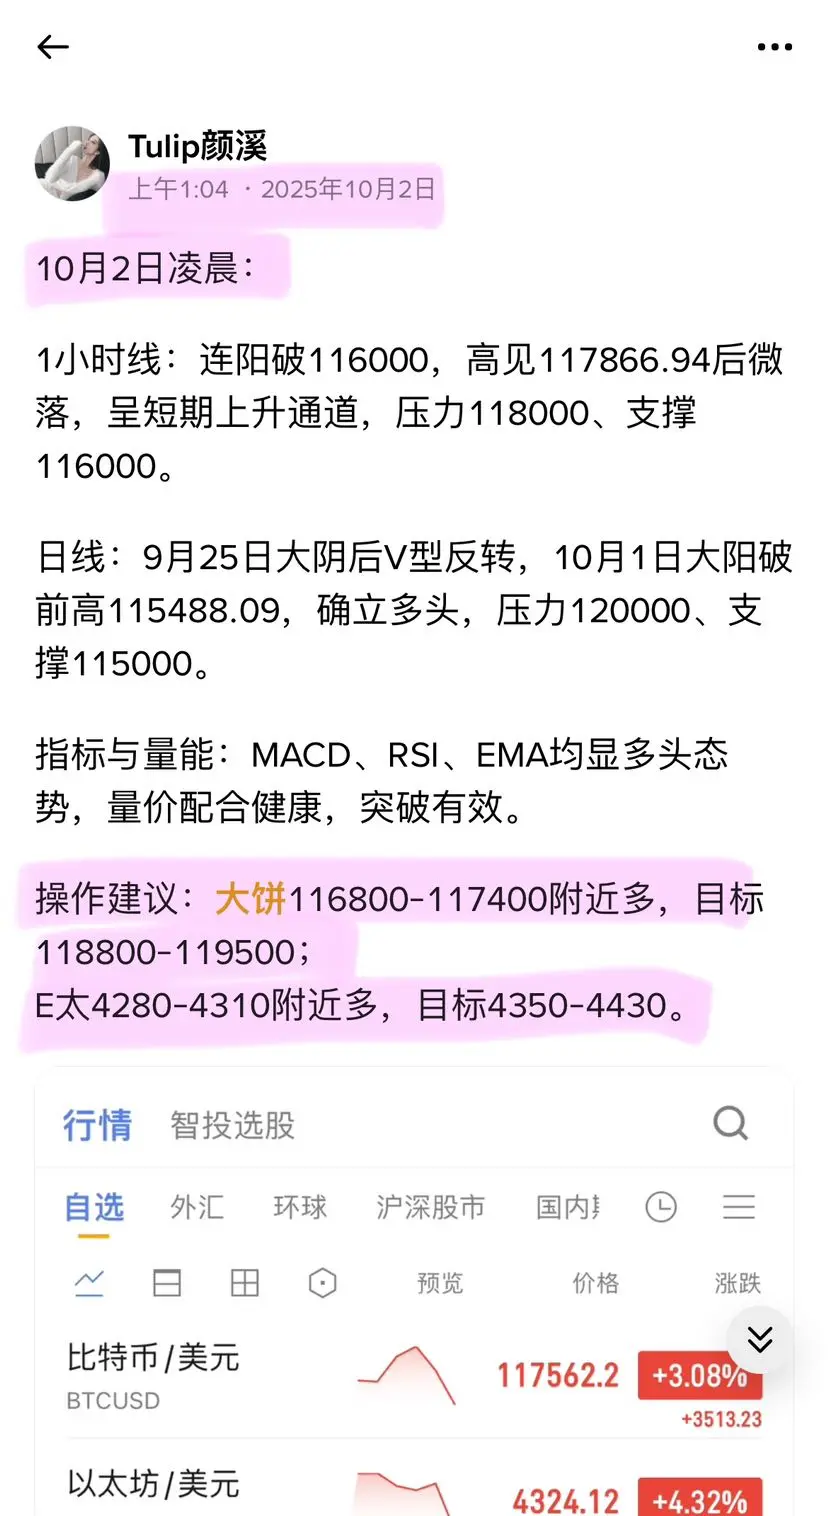
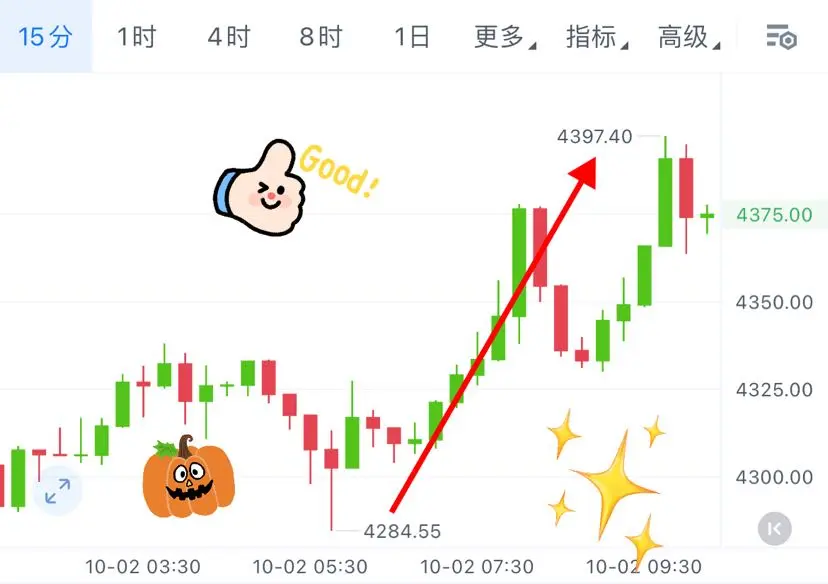
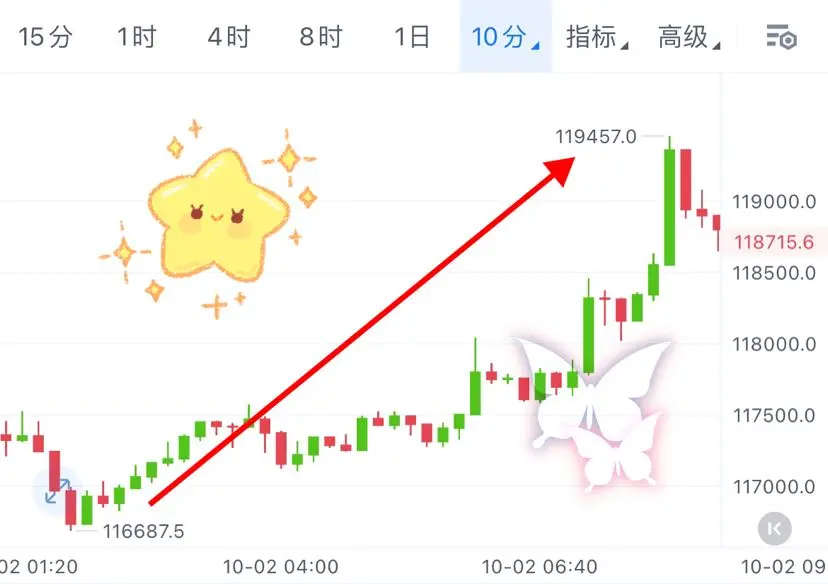
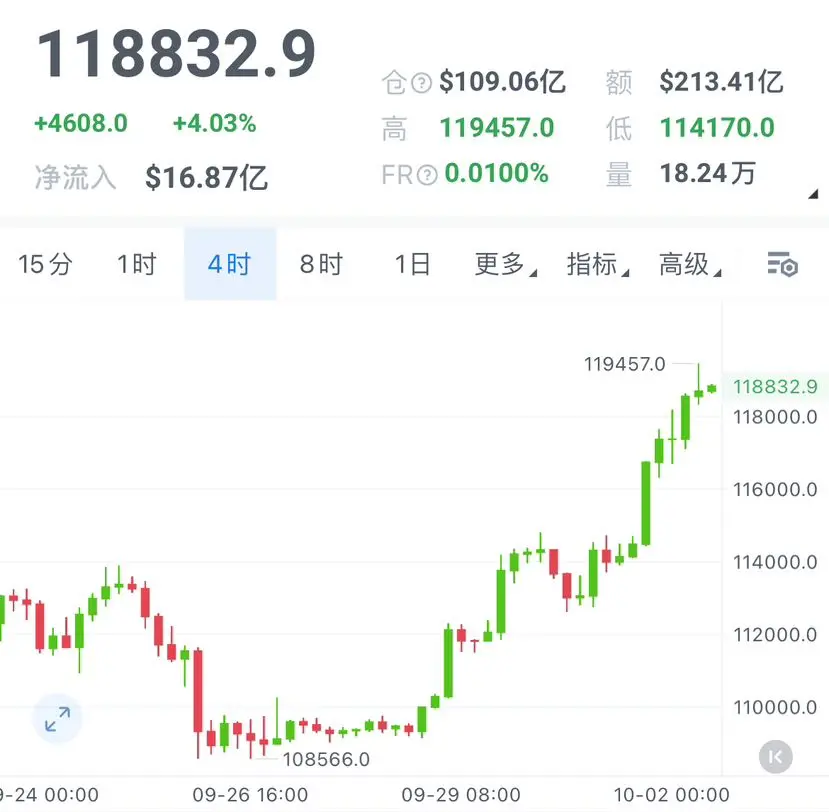
In the early morning of October 2nd:
1-hour chart: consecutive gains broke 116000, peaked at 117866.94 before a slight drop, forming a short-term ascending channel, with resistance at 118000 and support at 116000.
Daily: After a large bearish candle on September 25, a V-shaped reversal occurred, with a large bullish candle breaking the previous high of 115488.09 on October 1, establishing a bullish trend, with resistance at 120000 and support at 115000.
Indicators and Volume: MACD, RSI, and EMA all show a bullish trend, with healthy price-volume coordination and effective breakout.
Trading rec
View Original1-hour chart: consecutive gains broke 116000, peaked at 117866.94 before a slight drop, forming a short-term ascending channel, with resistance at 118000 and support at 116000.
Daily: After a large bearish candle on September 25, a V-shaped reversal occurred, with a large bullish candle breaking the previous high of 115488.09 on October 1, establishing a bullish trend, with resistance at 120000 and support at 115000.
Indicators and Volume: MACD, RSI, and EMA all show a bullish trend, with healthy price-volume coordination and effective breakout.
Trading rec
- Reward
- 1
- 1
- Repost
- Share
GateUser-5784b44b:
Written ha