
ONDO has quietly stayed on traders’ radars even through a pretty rough stretch for altcoins. After months of selling pressure, the price is finally starting to calm down near a major support area, and the chart is beginning to look a lot more interesting again.
The ONDO price hasn’t gone on a serious run yet, but the structure is tightening up in a way that usually comes right before a bigger move.
- The ONDO Price Is Getting Squeezed Inside a Falling Wedge
- Resistance Is the Wall ONDO Has to Break
- ONDO Price Outlook From Here
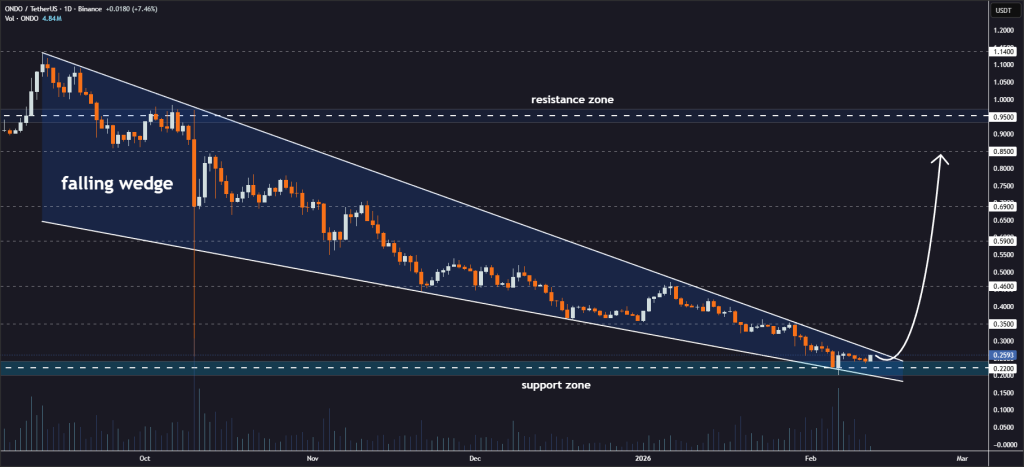
The ONDO Price Is Getting Squeezed Inside a Falling Wedge
On the daily chart shared by Jonathan Carter, the ONDO price has been trading inside a falling wedge for quite a while now. This pattern shows up when price keeps pushing lower, but each move down gets smaller and smaller.
That’s exactly what’s happening here. Sellers have been in control, but they’re losing momentum, and the range is compressing into a tighter channel. Now ONDO is pressing up against the upper edge of that wedge, which is usually the point where things start to heat up.
Source: X/@JohncyCrypto
These setups don’t stay quiet forever, once price runs out of space, volatility tends to come back fast. Support has also been holding strong around the $0.22–$0.25 zone, and buyers keep stepping in there.
Resistance Is the Wall ONDO Has to Break
The big level to watch now is wedge resistance just under $0.30. The ONDO price has been grinding right below it, and this is basically the make-or-break area. If bulls can finally push through, the chart opens up quickly.
The first upside levels traders are eyeing sit around $0.35 and $0.46, which match previous reaction zones. And if momentum really comes back, the bigger targets in the setup stretch toward $0.59, $0.69, and even $0.85.
Of course, nothing is guaranteed. If the ONDO price fails to break out and gets slapped back down, support becomes the key level all over again.
That $0.22 floor is doing a lot of heavy lifting right now. If it breaks, the wedge setup falls apart, and price could slide into another weak leg lower. That’s why this zone matters so much, ONDO is sitting right at a turning point.
Here’s the (Ondo) ONDO Price If Tokenized Stocks Just Become DeFi’s Next Big Collateral Boom_**
ONDO Price Outlook From Here
At the moment, the ONDO price is stuck in a classic squeeze. Support is holding, resistance is tightening, and the wedge is almost complete. That combination usually leads to a sharp move once the market finally chooses a direction.
If ONDO breaks above the wedge, upside targets show up fast. If it doesn’t, traders will be watching support closely for the next reset. Either way, ONDO isn’t drifting anymore, it’s setting up for a real decision move.
Disclaimer: The information on this page may come from third parties and does not represent the views or opinions of Gate. The content displayed on this page is for reference only and does not constitute any financial, investment, or legal advice. Gate does not guarantee the accuracy or completeness of the information and shall not be liable for any losses arising from the use of this information. Virtual asset investments carry high risks and are subject to significant price volatility. You may lose all of your invested principal. Please fully understand the relevant risks and make prudent decisions based on your own financial situation and risk tolerance. For details, please refer to
Disclaimer.
Related Articles
XRP Breaks Above $1.40 as Spot ETF Inflows Hit $17.6M Milestone
XRP breaks $1.40 after Ripple partnership boosts investor confidence and market momentum.
Spot XRP ETFs record $17.6M inflows, signaling rising institutional demand and interest.
Technical indicators show resistance ahead, with support holding near $1.40 and $1.3840.
Ripple’s XRP is
CryptoNewsLand2h ago
PEPE Reclaims 0.00000400 — Is This 1.8% Move the Start of a Bigger Run?
PEPE rebounds from 0.00000385 support, forming higher lows and stronger bullish structure.
Technical indicators like MACD and RSI show momentum with room for further upside.
Key resistance at 0.00000410; support at 0.00000380 critical for trend continuation.
PepeCoin — PEPE, has
CryptoNewsLand6h ago
ETH drops 0.58% in 15 minutes: derivatives liquidity contraction and proactive position reduction dominate short-term pullback
From 2026-04-19 04:30 to 2026-04-19 04:45 (UTC), within ETH’s 15-minute candlestick chart, the return recorded -0.58%, and the price range was 2321.62 to 2342.04 USDT, with an amplitude of 0.87%. The short-term selloff occurred against a backdrop of increased overall market volatility and a broad decline in the prices of major crypto assets; overall market risk appetite clearly fell, and traders’ wait-and-see sentiment strengthened.
The main driver behind this abnormal move is a sharp contraction in liquidity in the derivatives market and leveraged funds proactively reducing positions. Data shows that over the past 24 hours, the ETH/USD perpetual contract trading volume dropped 67.16% to approximately 74.87 million, open interest edged down 3.33% to 329 million, and liquidation amounts did not expand unusually. This structure indicates that the market lacks the risk of passive cascades; more funds chose to proactively step aside and wait on the sidelines, intensifying short-term selling pressure.
In addition, the long/short structure in which shorts held the upper hand (long/short ratio 47.48%:52.52%) and sentiment synchronization with the panic range reinforced the downward price trend. During the same period, major coins such as BTC and SOL also fell 2%-3.4% in tandem, further showing that this pullback was driven by system-wide risk sentiment. On-chain funds did not show any large abnormal transfers or large-scale liquidations of DeFi protocols; spot and on-chain liquidity remained generally stable, and no sudden system risk resonance was observed.
Current volatility-related risks still need close monitoring, especially as overall risk appetite continues to contract—ETH’s short-term price may face further downside probing. Watch subsequent changes in derivatives trading volume and open interest, extreme shifts in the long/short ratio and funding rate, and promptly monitor on-chain fund flows, large transfers, and any signs of amplified platform net outflows. For more market anomalies and deeper analysis, please continue to follow our upcoming market updates.
GateNews7h ago
Spark Protocol's January delisting of rsETH proves prudent as Aave faces ETH liquidity crisis
Spark Protocol's strategy of delisting low-usage assets and tightening collateral has faced initial backlash but proved wise during market turmoil. While maintaining higher interest rate caps, SparkLend ensures liquidity, unlike Aave, which now faces significant risks.
GateNews8h ago
Request Network (REQ) Surges 23.68% in 15 Minutes, 24-Hour Gain Reaches 116.52%
Request Network (REQ) surged 23.68% in just 15 minutes, reaching $0.152, with a 24-hour rise of 116.52% and trading volume over $8 million. Factors include retail interest and whale accumulation. Resistance at $0.160 and support at $0.122 are under observation.
GateNews9h ago
Solana Price Stalls Near $80 as ETF Outflows Weigh
Solana trades around $80, facing bearish sentiment due to ETF outflows and declining retail participation. Technical indicators show mixed signals, with resistance at $87 and $98, while support at $77 remains critical for stability.
CryptoFrontNews13h ago
