
Key Takeaways:
-
Ondo (ONDO) is trading near a critical support zone around $0.32 after a sharp market-wide sell-off.
-
The daily chart shows a right-angled descending broadening wedge, a pattern often linked to potential bullish reversals.
-
Buyers are defending the lower wedge boundary, suggesting selling pressure may be weakening.
-
The 100-day moving average near $0.53 remains a major resistance that must be reclaimed for trend reversal confirmation.
-
A successful rebound could open the door for a recovery toward the $1.10–$1.17 resistance zone, while a breakdown below $0.32 would invalidate the bullish setup.
The real-world asset (RWA) token Ondo (ONDO) is trading under pressure near $0.35, extending its short-term downtrend amid a broader crypto market sell-off. The latest wave of weakness follows escalating US–EU trade tensions, which sparked over $851 million in long liquidations, dragging major assets like Bitcoin (BTC) and Ethereum (ETH) down by roughly 2.5% and 4.5%, respectively, over the past 24 hours.
ONDO itself is down 5.98% at the time of writing. However, despite the bearish momentum, the daily chart suggests price is approaching a technically important zone where a potential rebound setup could begin to form.
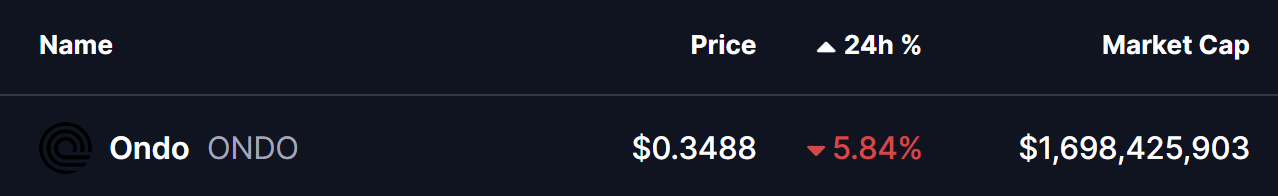
Source: Coinmarketcap
Right-Angled Descending Broadening Wedge in Focus
From a technical perspective, Ondo’s daily chart is carving out a right-angled descending broadening wedge, a pattern that often appears during extended corrective phases and can precede bullish reversals if support holds.
This structure has been developing since ONDO’s rejection from the neckline resistance zone around $1.00–$1.17 back in September 2025. Since then, price has continued to print lower highs while gradually expanding volatility, pushing ONDO down toward the lower boundary of the wedge near $0.32.
Notably, selling pressure appears to be easing near this zone. Buyers have stepped in to defend the level, with ONDO currently hovering slightly above it around $0.348 — a sign that demand may be emerging after weeks of sustained downside.
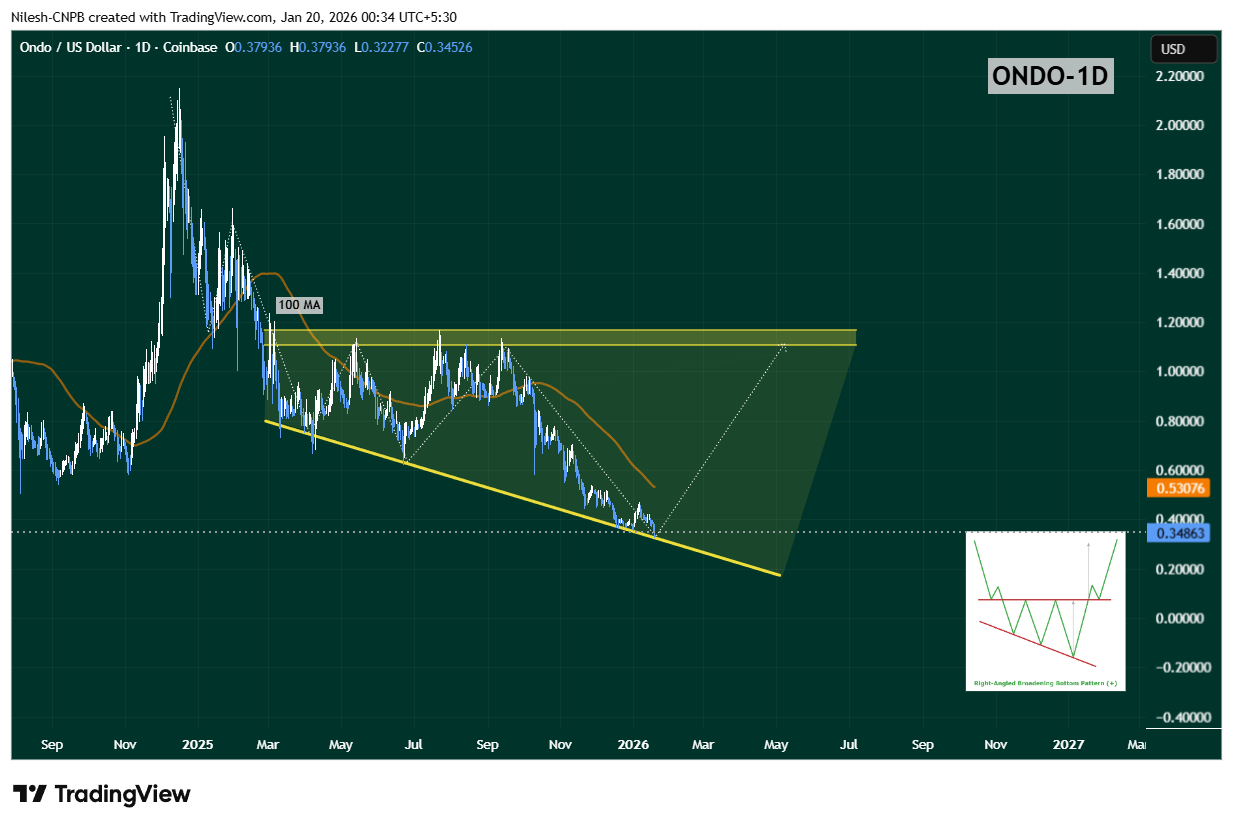
Ondo (ONDO) Daily Chart/Coinsprobe (Source: Tradingview)
While the lower wedge support is holding for now, upside momentum remains constrained. The 100-day moving average, currently positioned near $0.53, has flipped into strong overhead resistance. Each prior rally attempt has stalled below this level, reinforcing its importance as a confirmation point for any meaningful trend reversal.
Until ONDO can reclaim this moving average, any bounce should be viewed as a relief rally within a broader consolidation, rather than a confirmed rebound.
What’s Next for ONDO?
As long as ONDO continues to defend the $0.32 support zone, the right-angled descending broadening wedge remains technically valid. Sustained holding above this level keeps the door open for a rebound attempt, particularly if price begins forming higher daily or weekly closes.
A successful reclaim of the 50-day moving average, followed by a breakout above the 100-day MA, would mark a clear shift in momentum. If that scenario unfolds, ONDO could gradually work its way back toward the upper boundary of the wedge, which currently aligns near the $1.10–$1.17 region — a level that would represent a significant recovery from current prices.
On the flip side, a decisive breakdown below $0.32 would invalidate the bullish wedge structure and likely expose ONDO to another leg of downside or prolonged consolidation.
Bottom Line
Ondo is currently sitting at a critical technical crossroads. While broader market sentiment remains fragile, the chart suggests ONDO is testing a zone where seller exhaustion could give way to a bounce. The next few sessions will be crucial. How price reacts around the lower wedge support will likely determine whether ONDO can stage a meaningful rebound — or whether bears retain control for longer.
Disclaimer: The views and analysis presented in this article are for informational purposes only and reflect the author’s perspective, not financial advice. Technical patterns and indicators discussed are subject to market volatility and may or may not yield the anticipated results. Investors are advised to exercise caution, conduct independent research, and make decisions aligned with their individual risk tolerance.
About Author: Nilesh Hembade is the Founder and Lead Author of Coinsprobe, with over 5 years of experience in the cryptocurrency and blockchain industry. Since launching Coinsprobe in 2023, he has been providing daily, research-driven insights through in-depth market analysis, on-chain data, and technical research.
Disclaimer: The information on this page may come from third parties and does not represent the views or opinions of Gate. The content displayed on this page is for reference only and does not constitute any financial, investment, or legal advice. Gate does not guarantee the accuracy or completeness of the information and shall not be liable for any losses arising from the use of this information. Virtual asset investments carry high risks and are subject to significant price volatility. You may lose all of your invested principal. Please fully understand the relevant risks and make prudent decisions based on your own financial situation and risk tolerance. For details, please refer to
Disclaimer.
Related Articles
Today, the cryptocurrency Fear & Greed Index rose to 13, indicating extreme fear in the market.
Gate News reports that on March 27, data from Alternative.me shows that today’s cryptocurrency Fear and Greed Index has risen to 13, indicating the market is in a state of "extreme fear." Yesterday, the index was 10, also in the "extreme fear" zone.
GateNews25m ago
23.91% Plunge for KMD: What It Means for Traders
KMD has seen a significant decline, trading at $0.005324 after dropping 54.20% in 24 hours. Increased market activity and liquidation events in the derivatives market are contributing to the volatility, prompting traders to focus on risk management.
Coinfomania34m ago
MemeCore Price Volatility Explodes After Hardfork and Perp Listing Surge - BTC Hunts
The post MemeCore Price Volatility Explodes After Hardfork and Perp Listing Surge appeared first on Coinpedia Fintech News
MemeCore price just pulled off one of those blink-and-you-miss-it moves. A brutal 65% intraday surge sent the token flying from $1.70 to $2.80 only to slam straight into a
BTCHUNTS1h ago
The situation in the US-Iran war worsens, oil prices rise by 4%, and the surge in US Treasury yields impacts US stocks, causing them to fall.
Due to the worsening Middle East situation and soaring U.S. Treasury yields, concerns about inflation have intensified, causing the U.S. stock market to retreat and turning the sentiment cautious. Energy stocks rose against the trend, and crude oil prices broke through $100 per barrel, further fueling market panic. U.S. import prices experienced their largest increase since 2022, and postal services raised fuel surcharges, drawing attention to the consumer confidence index. The Federal Reserve chair succession process has stalled amid political disputes, and the cryptocurrency market remains flat as investors stay on the sidelines.
ChainNewsAbmedia2h ago
Crypto edges off of worst levels after Trump extends Iran strike pause
Bitcoin recovered after President Trump's announcement of a 10-day pause on attacks against Iran's energy infrastructure, helping stabilize markets following recent declines. Despite a volatile day, bitcoin is currently trading above $69,000, while other cryptocurrencies also saw some rebound.
CoinDesk3h ago
BTC 15-minute increase of 0.97%: Driven by active buying and ETF fund inflows pushing the market higher
On March 26, 2026, from 20:00 to 20:15 (UTC), the 15-minute spot Bitcoin (BTC) candlestick return was +0.97%, with a price range of 68,428.7 to 69,460.2 USDT and an amplitude of 1.51%. Trading volume during this period increased by 18% compared to the previous period, reaching approximately $120 million. Market attention significantly intensified, and short-term volatility increased.
The main driver of this movement was strong active buying in the spot market. Specifically, multiple large transfers of ≥1000 BTC appeared on-chain, with net inflows of BTC on major trading platforms totaling approximately 28.
GateNews4h ago
