MrHow77

vip
Age 0.7 Yıl
Peak Tier 0
No content yet
#GateSquareAprilPostingChallenge
Geopolitics vs Crypto Markets: The Hidden War for Global Liquidity
The global financial system is undergoing a silent transformation. Beneath headlines of conflict, inflation, and economic uncertainty, a deeper force is shaping markets:
👉 The competition for global liquidity
Crypto is no longer separate from geopolitics—it is becoming part of the same financial reaction system.
Current Macro Market Snapshot
Before understanding flows, look at the current global pricing pressure across key assets:
🛢️ Oil: $93.6
🪙 Gold (XAUt): $4,712
₿ Bitcoin (BTC): $73,173
BTC1,2%
XAUT2,15%
HighAmbition
#GateSquareAprilPostingChallenge
Geopolitics vs Crypto Markets: The Hidden War for Global Liquidity
The global financial system is undergoing a silent transformation. Beneath headlines of conflict, inflation, and economic uncertainty, a deeper force is shaping markets:
👉 The competition for global liquidity
Crypto is no longer separate from geopolitics—it is becoming part of the same financial reaction system.
Current Macro Market Snapshot
Before understanding flows, look at the current global pricing pressure across key assets:
🛢️ Oil: $93.6
🪙 Gold (XAUt): $4,712
₿ Bitcoin (BTC): $73,173
These three numbers represent three different dimensions of global risk:
Oil → inflation & supply shock pressure
Gold → traditional safe-haven demand
Bitcoin → digital liquidity & risk sentiment
Together, they define the current macro tension in the global economy.
The New Financial Battlefield: Liquidity
At the core of every market movement is one force:
👉 Liquidity flow
When geopolitical or economic tension rises, capital does not disappear—it rotates.
Historically, it moved into gold and the US dollar.
Now, it also flows into digital assets like Bitcoin.
Bitcoin as a Real-Time Macro Indicator
At $73,173, Bitcoin is positioned in a critical zone where it reacts instantly to global liquidity shifts.
Its behavior shows:
High sensitivity to macro news
Strong liquidity depth due to institutional participation
Intraday volatility reflecting global uncertainty cycles
Bitcoin is no longer just a speculative asset—it is becoming a real-time liquidity thermometer for global risk sentiment.
Gold vs Bitcoin vs Oil: The Three Pillars of Global Pressure
🛢️ Oil at $93.6
Oil remains the strongest inflation driver. Rising energy costs directly increase global financial stress and reduce risk appetite.
🪙 Gold at $4,712 (XAUt)
Gold continues to act as the traditional safe haven, reflecting long-term capital protection strategies during uncertainty.
₿ Bitcoin at $73,173
Bitcoin sits between both worlds:
Not fully traditional like gold
Not fully stable like fiat
But extremely responsive to liquidity expansion and contraction
Liquidity Flow: The Real Engine Behind Crypto
Crypto markets are no longer driven only by retail sentiment.
They respond to:
Central bank policy 💱
Inflation expectations 📈
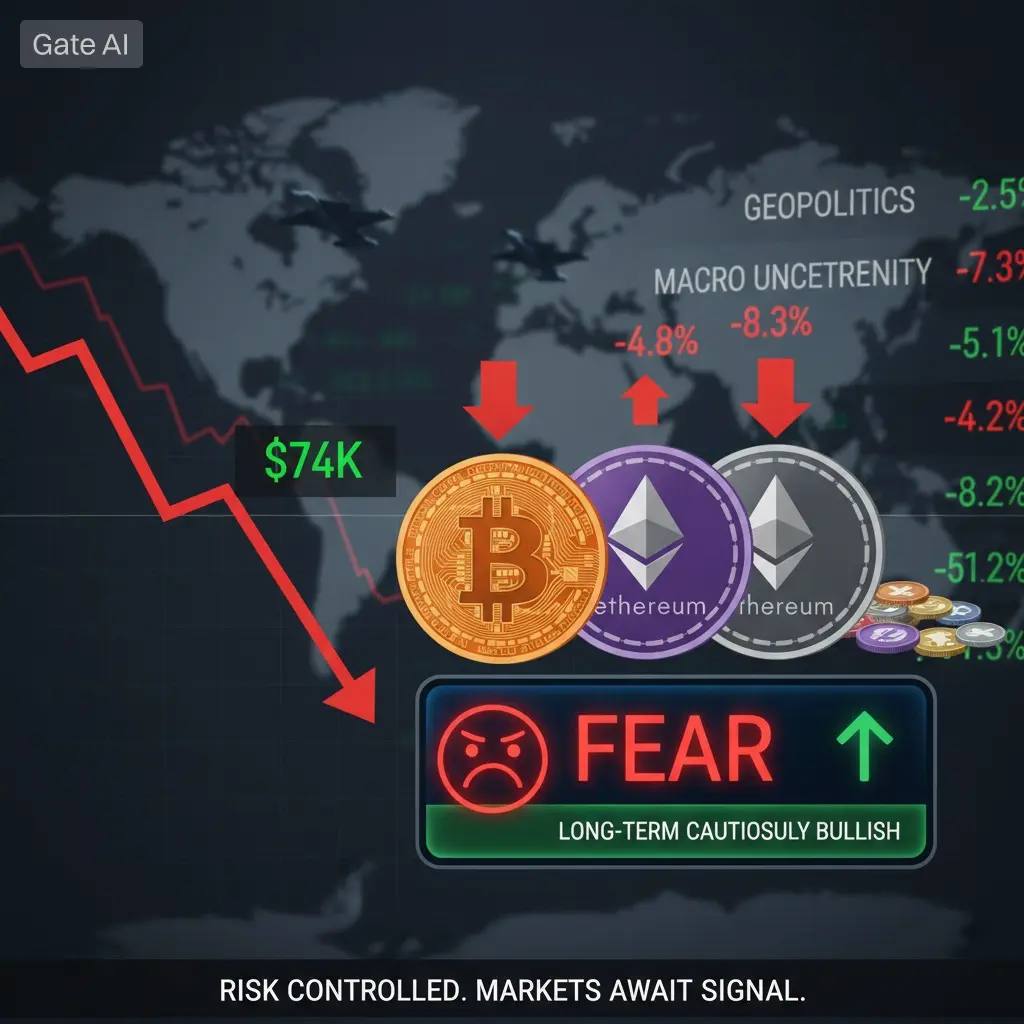
Geopolitical instability ⚔️
Energy market shocks 🛢️
When liquidity expands → crypto rallies
When liquidity tightens → crypto corrects
The Three Phases of Market Reaction
1️⃣ Risk-Off Phase
Capital moves out of risk assets
Short-term pressure on crypto
2️⃣ Inflation & Energy Shock Phase
Oil spikes → inflation rises
Investors seek hedges like gold and Bitcoin
3️⃣ Liquidity Expansion Phase
Monetary easing or capital injection
Strong recovery in risk assets, including crypto
The Strategic Shift: Digital vs Physical Value
The world is moving from physical dominance to digital liquidity dominance:
Oil = physical energy power
Gold = historical value preservation
Bitcoin = digital liquidity mobility
Each represents a different layer of global financial structure.
Final Insight
The current market setup shows a clear macro tension:
Oil at $93.6 is sustaining inflation pressure
Gold at $4,712 reflects strong safety demand
Bitcoin at $73,173 represents accelerating digital liquidity sensitivity
This is not just price movement—it is a reflection of global capital stress and rotation.
Crypto is no longer reacting in isolation.
It is now part of a synchronized global system where:
👉 Geopolitics moves liquidity
👉 Liquidity moves Bitcoin
👉 Bitcoin reflects global uncertainty in real time
repost-content-media
  • Reward
  • Comment
  • Repost
  • Share
#GateSquareAprilPostingChallenge
🔴 XRP Market Analysis (Current Price: $1.32) — Full Trading Breakdown
XRP is currently trading around $1.32, sitting at a very important technical zone where the market is showing tight consolidation and indecision. Buyers and sellers are actively fighting near support, and the next move will likely decide the short-term trend direction.
📊 Current Market Structure
💰 Current Price: $1.32
📉 Trend: Sideways / Weak bearish pressure
⚖️ Market Phase: Accumulation vs Distribution battle
🧠 Sentiment: Mixed (fear + early accumulation signals)
📊 Volatility: Modera
XRP0,51%
BTC1,2%
HighAmbition
#GateSquareAprilPostingChallenge
🔴 XRP Market Analysis (Current Price: $1.32) — Full Trading Breakdown
XRP is currently trading around $1.32, sitting at a very important technical zone where the market is showing tight consolidation and indecision. Buyers and sellers are actively fighting near support, and the next move will likely decide the short-term trend direction.
📊 Current Market Structure
💰 Current Price: $1.32
📉 Trend: Sideways / Weak bearish pressure
⚖️ Market Phase: Accumulation vs Distribution battle
🧠 Sentiment: Mixed (fear + early accumulation signals)
📊 Volatility: Moderate but preparing for expansion
👉 Market is not trending clearly — it is coiling for a big move
🟢 Key Support Levels
$1.30 → Immediate strong support zone
$1.25 → Critical demand area (buyers active)
$1.18 → Breakdown level (bearish trigger)
👉 As long as $1.30 holds, bulls stay alive.
🔴 Key Resistance Levels
$1.35 – $1.38 → Short-term rejection zone
$1.45 → Major resistance barrier
$1.50 – $1.52 → Breakout confirmation zone
👉 Above $1.52 = strong bullish reversal possible
📉 Market Sentiment (What Traders Are Thinking)
🐻 Bear Case
Price rejection under $1.38
Target: $1.25 → $1.18
Reason: weak momentum + global uncertainty
⚖️ Neutral Case
Range trading between $1.30 – $1.45
Strategy: buy low, sell high
🐂 Bull Case
Break above $1.52
Momentum shift + trend reversal
Targets: $1.80 → $2.20+
🚀 Price Forecast (Next Moves)
📅 Short Term (Days–Weeks)
Expected Range: $1.25 – $1.45
Most likely: sideways consolidation continues
Breakout expected soon due to compression
📅 Mid Term (2026 Outlook)
Base case: $1.50 – $2.00
Bull case: $2.20 – $3.00
Bear case: $1.00 – $1.15
📈 Trading Strategy (Simple & Practical)
⚡ Scalping Strategy
Buy: $1.30 – $1.32
Sell: $1.38 – $1.45
Stop loss: below $1.28
📊 Swing Strategy
Accumulate near $1.30 support
Hold until breakout $1.52
Targets: $1.80+
🔥 What Will Decide Next Big Move?
🟢 Bullish Triggers
Break and close above $1.38
Strong Bitcoin uptrend
Increased liquidity inflows
🔴 Bearish Triggers
Loss of $1.30 support
BTC correction
Weak volume continuation
📌 Final Conclusion
👉 XRP at $1.32 is in a critical decision zone
👉 Market is not trending — it is preparing for breakout
👉 Next big move depends on $1.30 support & $1.38 resistance
🎯 Key Takeaway:
Above $1.38 → bullish momentum starts
Below $1.30 → bearish pressure increases
Between → range trading continues
repost-content-media
  • Reward
  • Comment
  • Repost
  • Share
#AaveDAOApproves$25MGrant

1. The Big News: Aave DAO Approves $25M Strategic Grant — Full Breakdown
On April 13, 2026, the Aave DAO approved one of the most significant governance decisions in its history: the “Aave Will Win Framework” proposal.
The vote concluded with a decisive 522,780 votes in favor versus 175,310 against, representing approximately 75% approval, a strong signal of internal alignment and long-term conviction across the DAO.
The proposal allocates:
$25 million in stablecoins (aEthLidoGHO)
75,000 AAVE tokens (~$6.8 million at current valuation)
The structure is deliberately
HighAmbition
#AaveDAOApproves$25MGrant

1. The Big News: Aave DAO Approves $25M Strategic Grant — Full Breakdown
On April 13, 2026, the Aave DAO approved one of the most significant governance decisions in its history: the “Aave Will Win Framework” proposal.
The vote concluded with a decisive 522,780 votes in favor versus 175,310 against, representing approximately 75% approval, a strong signal of internal alignment and long-term conviction across the DAO.
The proposal allocates:
$25 million in stablecoins (aEthLidoGHO)
75,000 AAVE tokens (~$6.8 million at current valuation)
The structure is deliberately designed for sustainability rather than short-term stimulation:
$5 million is released immediately
Remaining funds are distributed in two tranches over 6 and 12 months
AAVE tokens are vested linearly over 48 months from ecosystem reserves, removing immediate sell pressure
Any unused capital must be returned to the DAO treasury after 12 months
All funds are directed to Aave Labs, the core development team, with a single objective: accelerate the expansion and adoption of Aave V4, which went live on Ethereum mainnet just three days earlier on April 10, 2026.
This is not simply funding — it is a coordinated protocol-level scaling mandate.
2. Market Snapshot: Price, Momentum & Structural Context
AAVE is currently trading around $102.07, recording a strong +13.9% 24-hour gain.
Recent price action:
24H High: $102.10
24H Low: $89.49
7D Change: +6.48%
30D Change: -12.23%
90D Change: -42.8%
Market capitalization sits near $1.54 billion, ranking AAVE around the top 55 cryptocurrencies globally.
Daily trading volume has surged to approximately $487 million, marking the highest liquidity inflow in over a month — a strong indication that this move is fundamentally driven rather than speculative noise.
Total Value Locked (TVL) remains dominant at $26.4 billion, making Aave the largest lending protocol in DeFi by a wide margin.
Meanwhile, the GHO stablecoin supply has expanded by 8%, surpassing $312 million, reinforcing ecosystem activity post-announcement.
3. Why the $25M Grant Matters for Price Action
The grant is structurally bullish, but its impact should be understood as a multi-phase catalyst, not an immediate price driver.
Positive structural signals:
75% DAO approval reflects strong governance alignment
Capital is explicitly tied to V4 acceleration and ecosystem expansion
Token emissions are long-term distributed, limiting dilution shocks
The “Aave Will Win” narrative is now formally institutionalized
This creates a powerful mix of narrative + execution capital + token stability.
However, key risks remain:
Just days before the vote, Chaos Labs, Aave’s long-standing risk management partner responsible for safeguarding over $26B in TVL, announced its departure due to strategic disagreements over V4 risk direction.
This introduces a critical transitional gap in risk governance, which markets have not fully priced in yet.
Additionally, AAVE remains structurally down over 40% on the 90-day timeframe, confirming that the current move is still a rebound within a broader corrective phase, not a confirmed macro trend reversal
4. Aave Roadmap: From DeFi Leader to Institutional Infrastructure Layer
With Aave V4 now live, the protocol enters its most aggressive expansion phase to date.
Key roadmap phases include:
Multi-chain expansion across Arbitrum, Base, Optimism, Polygon, and zkSync (Q2–Q3 2026)
Launch of Aave Pro, an institutional-grade lending layer introduced at EthCC Cannes
GHO v2 development with cross-chain functionality targeted for Q3 2026
Replacement and redesign of the protocol’s risk management framework following Chaos Labs’ exit
The long-term vision is clear: transforming Aave into the on-chain equivalent of a global banking infrastructure layer, often compared to a decentralized version of JPMorgan in lending markets.
The newly secured $25M grant significantly accelerates this trajectory.
5. Why Aave V4 Is a Structural Game-Changer
Aave V4 represents a full architectural evolution rather than an incremental upgrade.
Key improvements include:
Fully permissionless market creation with faster listing mechanisms
Dynamic risk engine adjusting parameters in real time
Estimated 20–30% improvement in capital efficiency
Native cross-chain liquidity reducing bridge dependency risks
Institutional vaults with optional compliance layers via Aave Pro
If successfully executed, analysts project that V4 could push Aave’s TVL beyond $30 billion within 6–9 months, reinforcing its dominance in decentralized lending.
6. Competitive Landscape: Aave’s Structural Dominance
Across DeFi lending, Aave maintains a clear leadership position.
Aave ($26.4B TVL): Market leader with deep liquidity, strong branding, and now V4 scalability
Compound ($8.2B TVL): Stable but slow-moving, lacking major recent innovation cycles
MakerDAO ($9.1B TVL): Strong stablecoin ecosystem but slowed by governance complexity
Morpho ($4.8B TVL): Efficient and innovative but still niche compared to full-stack lending dominance
The key differentiation is not just size — it is network effects + institutional readiness + execution speed, all of which currently favor Aave.
7. Technical Market Structure: Momentum vs Overextension
Short-term indicators show strong bullish momentum:
Bullish alignment across short timeframes
ADX above 40 confirming strong trend strength
Parabolic SAR flipped bullish
Volume expansion confirming conviction buying
However, higher timeframe signals suggest caution:
Daily RSI deeply overbought (~86)
CCI and Williams %R indicating exhaustion
90-day trend still firmly bearish
Key levels:
Resistance: $110–$115
Support: $95 zone
Strong accumulation zone: $88–$92
Overall structure: high-momentum relief rally inside a broader downtrend
8. On-Chain Strength Indicators
On-chain data continues to support accumulation behavior:
Active borrowers up ~18% weekly
ETH utilization stable at ~68%
Liquidations remain low (~$1.2M daily)
Top 100 wallets increased holdings by ~2.4% post-announcement
This indicates smart money accumulation during early narrative expansion.
9. Strategic Trading Framework
Short-Term Traders:
Avoid chasing momentum above $100. Wait for retracement zones near $90–$97 for lower-risk entries.
Swing Traders:
Treat current structure as a catalyst-driven swing cycle:
Entry: $90–$97
Targets: $115 → $125
Invalidated below: $87
Long-Term Investors:
This represents one of Aave’s strongest fundamental resets in years:
Dollar-cost averaging between $85–$95 is optimal
6–12 month upside range: $150–$180 (if V4 executes successfully)
10. Scenario-Based 12-Month Outlook
Bull Case: V4 adoption accelerates, TVL exceeds $35B → $180+
Base Case: Stable execution, steady growth → $140–$160
Bear Case: Risk governance issues + macro weakness → $65–$75
11. Historical Context: Why This Grant Matters
Previous Aave ecosystem catalysts provide context:
GHO launch funding (2023): +68% rally in ~3 weeks
V3 expansion funding (2024): +41% gain in ~45 days
The current $25M grant is the largest in Aave history, making it potentially the most impactful catalyst cycle to date.
12. Governance & Ecosystem Participation
AAVE token holders can actively participate in governance via:
Snapshot voting (off-chain signaling)
On-chain execution proposals
Delegation to active governance contributors
Proposal submission (requires 80 AAVE minimum)
DAO activity is currently focused on replacing risk management leadership, making this a critical governance transition phase.
13. Sentiment Landscape
Social sentiment: ~79% bullish
Discussion volume: +33% weekly increase
Market Fear & Greed Index: ~12 (extreme fear)
X trend: “Aave Will Win” gaining traction rapidly
This reflects a contrarian strength setup, where asset performance diverges from broader market fear.
14. Key Risks & Final Verdict
Key Risks:
Chaos Labs departure creates temporary risk governance uncertainty
Overbought short-term technical conditions
Macro headwinds still dominate broader crypto
Grant capital deployment is gradual, not immediate
Systemic market volatility remains elevated
Final Verdict
The combination of the $25M DAO grant, V4 launch, and ecosystem expansion strategy represents a defining structural moment for Aave.
This is not just a price rally — it is a protocol evolution phase being repriced by the market in real time.
Short-term volatility is likely to continue, but the medium-term structure is increasingly tied to execution success rather than speculation alone.
If price maintains above $95, bullish continuation remains intact. A break below $87 would weaken momentum significantly.
For disciplined traders, the opportunity lies not in chasing momentum, but in positioning during structured pullbacks while the narrative unfolds.
repost-content-media
  • Reward
  • Comment
  • Repost
  • Share
#BTCMarketAnalysis
🧠 CURRENT MARKET ENVIRONMENT
At this stage, Bitcoin is no longer simply moving within a traditional technical trend structure. Instead, it is operating inside a highly engineered liquidity environment, where price action is increasingly driven by positioning imbalances, stop-loss clusters, and institutional order flow rather than organic spot demand alone.
The move from the $70,000 region toward $74,450 has created a critical transitional zone where both bulls and bears are being forced into uncertainty. This is a classic phase seen before major expansion legs — where vol
BTC1,2%
HighAmbition
#BTCMarketAnalysis
🧠 CURRENT MARKET ENVIRONMENT
At this stage, Bitcoin is no longer simply moving within a traditional technical trend structure. Instead, it is operating inside a highly engineered liquidity environment, where price action is increasingly driven by positioning imbalances, stop-loss clusters, and institutional order flow rather than organic spot demand alone.
The move from the $70,000 region toward $74,450 has created a critical transitional zone where both bulls and bears are being forced into uncertainty. This is a classic phase seen before major expansion legs — where volatility compresses and then expands violently once liquidity is fully engineered.
Importantly, price is no longer responding purely to visible support and resistance levels. Instead, it is reacting to invisible liquidity layers — including liquidation zones, leveraged positioning, and algorithmic order clustering. In such environments, price movements often appear random to retail participants, but are highly structured from a liquidity execution perspective.
🔵 BULL CASE (INSTITUTIONAL ACCUMULATION VIEW)
From a bullish structural perspective, Bitcoin remains in a broader uptrend continuation framework, as higher timeframe market structure still reflects a sequence of higher lows and higher highs.
The defense of the $70,000 demand zone is particularly significant. This level is not just technical support — it represents a high-conviction institutional accumulation area, where large participants historically scale into positions during volatility.
Additionally, the nature of the recent upward move suggests aggressive liquidity absorption on the buy side. Instead of multiple rejections or prolonged consolidation, price has moved in a relatively clean and impulsive manner, which typically indicates that sell-side liquidity is being absorbed efficiently rather than overpowering demand.
Above current levels, the $75,000 to $78,000 zone becomes a major liquidity magnet. This region contains:
breakout trader stop orders
short liquidation clusters
sidelined institutional capital waiting for confirmation
In liquidity-driven markets, these zones often act as attractors rather than resistance, meaning price naturally gravitates toward them when momentum aligns with structure.
🔴 BEAR CASE (LIQUIDITY TRAP RISK MODEL)
From the bearish perspective, the primary concern is the speed and efficiency of the upward move, which has created a structural imbalance.
When price expands rapidly without sufficient retesting or consolidation, it often signals a liquidity sweep rather than a sustainable breakout. In such cases, early momentum is used to attract late long positions before a reversal phase begins.
Another key concern is the lack of a proper retest of the $70,000 breakout zone. In classical market structure, retests serve as confirmation of acceptance above a level. Without this validation, the breakout remains statistically weaker and more vulnerable to failure.
Additionally, the $75,000–$76,000 region carries strong psychological weight. Historically, such zones attract profit-taking from early buyers while simultaneously triggering short entries from reversal traders. If price enters this region without strong continuation volume, the probability of rejection increases significantly.
⚔️ DEEP MARKET TRUTH (INSTITUTIONAL VIEW)
When both bullish and bearish structures are analyzed together, the most accurate interpretation is that Bitcoin is currently inside a liquidity engineering phase, not a directional trend phase.
This means the market is actively balancing two opposing forces:
continuation pressure from accumulation
reversal pressure from distribution risk
The purpose of this phase is not to move cleanly in one direction, but to force mispositioning on both sides before expansion.
Such equilibrium phases do not last long. They typically resolve through a liquidity expansion event, either above $75,000 or below $72,000.
🧲 LIQUIDITY STRUCTURE INSIGHT (ADDITIONAL LAYER)
Liquidity is currently asymmetrically distributed:
Above price: liquidity is visible and concentrated, meaning upside moves can accelerate rapidly once triggered
Below price: liquidity is deeper and more layered, meaning downside moves may be slower but structurally more destructive if activated
This imbalance increases the probability of sharp liquidity grabs in both directions, depending on which side is targeted first by large players.
Ultimately, the next major move will not be driven by sentiment or news flow — but by which liquidity pool gets consumed first.
🧠 SMART MONEY STRATEGY (REFINED POSITIONING MODEL)
Professional market participants are not currently committed to directional bias. Instead, they operate in a probabilistic framework, positioning on both sides of key liquidity zones.
This means:
Long exposure is favored near demand zones ($70K–$72K region)
Short exposure is favored near resistance liquidity zones ($75K–$78K region)
The most important principle in this environment is patience. Mid-zone trading exposes participants to manipulation risk and false breakouts.
Optimal execution exists only at liquidity extremes, not in the middle of the range.
🎯 FINAL INSTITUTIONAL CONCLUSION
Bitcoin is currently in a critical liquidity transition phase, where short-term direction is being determined by institutional order flow rather than retail sentiment or simple technical analysis.
The broader structure remains mildly bullish on higher timeframes, but short-term behavior reflects liquidity manipulation dynamics near major resistance zones.
The single most important level in the current structure is:
🟡 $75,000 — FINAL LIQUIDITY DECISION ZONE
A clean breakout and acceptance above $75K confirms expansion toward higher liquidity targets
A rejection from this zone increases probability of a sweep back toward $72K and deeper liquidity clusters
Until this level is resolved, Bitcoin remains in a high-volatility equilibrium state, where both bullish continuation and bearish reversal scenarios remain equally valid.
repost-content-media
  • Reward
  • Comment
  • Repost
  • Share
#CryptoMarketsDipSlightly .
How Much Did the Market Actually Dip?
Bitcoin declined 0.85% over the past 24 hours and is currently trading at $74,150. Ethereum dropped 1.27% to $2,339, XRP fell 2.00% to $1.36, and Solana posted the largest decline among major assets at -3.25%, now sitting at $86.
Bitcoin showed relative strength, limiting its broader move to roughly -0.85% to -2.6%. In contrast, altcoins absorbed sharper losses, with SOL and ETH each shedding over 3%. This pattern is textbook risk-off dynamics: Bitcoin often acts as the market leader and safe haven within crypto, while higher-be
HighAmbition
#CryptoMarketsDipSlightly .
How Much Did the Market Actually Dip?
Bitcoin declined 0.85% over the past 24 hours and is currently trading at $74,150. Ethereum dropped 1.27% to $2,339, XRP fell 2.00% to $1.36, and Solana posted the largest decline among major assets at -3.25%, now sitting at $86.
Bitcoin showed relative strength, limiting its broader move to roughly -0.85% to -2.6%. In contrast, altcoins absorbed sharper losses, with SOL and ETH each shedding over 3%. This pattern is textbook risk-off dynamics: Bitcoin often acts as the market leader and safe haven within crypto, while higher-beta altcoins amplify both upside and downside moves. The correction was meaningful — enough to shake out weak positions — but far from the panic-driven capitulations seen in previous cycles.
What Caused the Dip? The Root Triggers and Deeper Debate
Three interconnected forces drove the move, sparking lively debate among analysts about whether this is a short-term shock or the start of something more prolonged.
Geopolitical Shock — U.S.-Iran Negotiations Collapse
The dominant catalyst was the breakdown of high-level U.S.-Iran peace talks in Islamabad. Reports quickly surfaced of a potential Trump administration naval blockade in the Strait of Hormuz — a critical chokepoint for global oil shipments. This classic risk-off event prompted institutional desks to trim exposure across equities, commodities, and crypto alike.
The Debate: Bears argue this escalation could drag on for weeks or months, keeping energy prices volatile and risk assets under pressure. Bulls counter that history shows geopolitical flares in the Middle East often prove temporary; markets have a habit of pricing in the worst and then recovering on any hint of de-escalation.
Trump’s latest comments suggesting Iran “wants to make a deal” add a layer of uncertainty — is this posturing for leverage, or a genuine opening for negotiations? Any positive headline could trigger a sharp relief rally, while further escalation risks pushing oil higher and crypto lower.
Persistent Macro Headwinds
Q2 2026 continues to be shaped by sticky inflation readings and lingering policy uncertainty around interest rates and fiscal measures. Traders who positioned for a swift macro tailwind have been left waiting.
CoinBureau founder Nic Puckrin captured the mood well: “Even if the war ends now, its repercussions will likely dominate the story of 2026 and Q2.”
Thinning CME Futures Positioning
CME Bitcoin futures open interest recently hit a 14-month low, reflecting the unwinding of popular basis trades as arbitrage yields compressed to around 5%. Institutions closing these hedged positions contributed to spot selling pressure — more calculated profit-taking than emotional panic.
Broader Discussion: Some see this as healthy deleveraging that reduces systemic risk in the futures market. Others worry it signals fading institutional enthusiasm in the short term. The silver lining? Lower leverage often sets the stage for more organic, sustainable moves once sentiment stabilizes.
Where Is the Market Right Now?
Bitcoin continues to consolidate around the key $74,150 psychological zone, which has emerged as an important battleground.
Key Levels to Watch:
Support: $70,500 (recent 24h low), followed by the major psychological floor at $70,000. A decisive daily close below $70K could accelerate selling toward $66,000–$68,000.
Resistance: $71,800 (24h high), with the critical macro breakout level at $76,000 acting as the next major hurdle.
Ethereum requires a convincing reclaim of $2,400 to signal any sustainable bullish momentum. Analyst Jordi Visser provided a clear dual-trigger thesis:
“If BTC trades above $76,000 and ETH above $2,400 simultaneously, that marks the beginning of a sustainable move upward.”
Until both conditions align, the market remains range-bound and headline-driven.
The Fear & Greed Index — Extreme Fear at 12
The Fear & Greed Index stands at 12/100, firmly in Extreme Fear territory. This reflects deep retail pessimism and widespread capitulation from weaker hands — historically a setup that has preceded meaningful recoveries.
The Debate Here: Extreme fear is often a contrarian buy signal, as it indicates the crowd has already sold. However, it can persist for weeks without an immediate bottom. Compared to past cycles (2021–22 peak drawdown of -54%, 2017–18 at -64%), the current structure feels more like a mild bear market or extended consolidation than outright capitulation. This milder drawdown, combined with ongoing institutional inflows, suggests the long-term foundation remains intact even as short-term noise dominates.
What Are Traders on X Saying? Sentiment Breakdown
Bearish Camp:
Bitcoin appears “fragile,” with any fresh macro or geopolitical headline capable of breaking the $70K support.
Altcoins continue struggling to sustain relief rallies amid thin volume and absent catalysts.
Overall tone: Caution prevails — “Avoid big bets, stay on the sidelines and watch developments.”
Bullish Undercurrent (Contrarians):
Large whales and institutions appear to be accumulating quietly at these discounted levels.
U.S. Spot BTC ETFs are still recording net inflows, signaling no broad institutional exodus.
Emerging narratives around potential XRP ETF approvals and continued corporate treasury adoption (including Strategy, formerly MicroStrategy) provide fresh bullish fuel.
Classic argument: “Extreme fear has historically been one of the best entry zones for patient, high-conviction capital.”
BTC Sentiment Snapshot (last 24h):
Bullish voices: 68 authors, 135 posts
Bearish voices: 45 authors, 89 posts
Bull-to-bear ratio ≈ 60/40 — mildly constructive even amid the dip.
Current Trend Assessment
Short-term (days to a week): Downward pressure with a sideways-to-bearish bias. No confirmed reversal signal yet.
Medium-term (weeks to Q2): Mild bear / consolidation phase, heavily influenced by geopolitical developments and macro data.
Long-term (months+): Structurally bullish. The combination of ETF adoption, corporate and sovereign buying, and maturing market infrastructure has not been derailed. This dip may ultimately be viewed as a healthy digestion period after the post-halving cycle.
The market is processing multiple overlapping shocks: geopolitical tension in the Strait of Hormuz, a challenging macro backdrop, and post-halving cooldown mechanics. Such periods test patience but often reward disciplined positioning.
Key Takeaways for Traders — Enhanced with Practical Advice
Defend $70,000 on BTC fiercely. A clean break lower opens risk toward $66K–$68K. Use tight stops and consider scaling in on strength if support holds.
Exercise extreme caution with altcoin bounces. In Extreme Fear environments, altcoins frequently underperform Bitcoin and deliver false rallies. Favor BTC dominance plays until sentiment improves.
Prioritize geopolitical monitoring. Set news alerts for U.S.-Iran updates, Hormuz developments, and oil price moves. A credible de-escalation headline could ignite a powerful short-covering rally.
The $76K BTC / $2,400 ETH dual breakout remains the clearest “all-clear” signal for a trend reversal.
Track ETF flows religiously. Persistent inflows during dips demonstrate institutional conviction and act as a leading indicator of underlying demand.
Position sizing and risk management are paramount. Extreme Fear can precede strong rebounds, but timing is notoriously difficult. Consider dollar-cost averaging, maintain dry powder, and avoid over-leveraging in uncertain conditions.
Additional Insight: This environment highlights the maturing nature of crypto markets. Unlike past cycles dominated by pure retail speculation, institutional participation provides a stronger floor — but it also means reactions to external shocks (like geopolitics) can be swift and synchronized.
Bottom Line
The #CryptoMarketsDipSlightly story is accurate yet nuanced. A geopolitical shock from the failed U.S.-Iran talks and potential Strait of Hormuz blockade served as the primary spark, amplified by thinning futures positioning and ongoing macro uncertainty.
Bitcoin is currently holding near $74,150, Ethereum at $2,339, XRP at $1.36, and Solana at $86, with the Fear & Greed Index at 12 painting a picture of widespread panic. However, the market is not in free fall. It is navigating a mild bear/deep consolidation phase that looks structurally less severe than previous downturns.
Institutional participation through ETFs and corporate treasuries continues unabated, suggesting the long-term uptrend remains alive. Near-term direction will likely hinge on geopolitics and Bitcoin’s ability to defend the $70K level.
For traders: Patience, disciplined risk management, and avoiding the urge to fight the macro are essential. The ingredients for the next leg higher are quietly building — but they demand composure rather than aggressive heroics.
repost-content-media
  • Reward
  • Comment
  • Repost
  • Share
#GateSquareAprilPostingChallenge
In the fast-moving world of cryptocurrency trading, leaderboards are more than just rankings — they serve as real-time pulse checks on market sentiment, capital rotation, and speculative fever. On Gate, one of the leading global exchanges, both Spot and Derivatives markets feature dynamic Top 3 lists across three key dimensions: Gainers, Losers, and Volume.
These rankings reveal where traders are aggressively buying, where they are exiting positions, and where the heaviest capital is flowing. Spot trading reflects actual asset ownership with linear risk, while
HighAmbition
#GateSquareAprilPostingChallenge
In the fast-moving world of cryptocurrency trading, leaderboards are more than just rankings — they serve as real-time pulse checks on market sentiment, capital rotation, and speculative fever. On Gate, one of the leading global exchanges, both Spot and Derivatives markets feature dynamic Top 3 lists across three key dimensions: Gainers, Losers, and Volume.
These rankings reveal where traders are aggressively buying, where they are exiting positions, and where the heaviest capital is flowing. Spot trading reflects actual asset ownership with linear risk, while Derivatives amplify moves through leverage, often intensifying volatility and creating feedback loops like short squeezes.
Analyzing both sides together offers a complete picture: Are the big moves backed by real liquidity and conviction, or are they fragile pumps in low-liquidity tokens? Let's break it down in detail.
PART 1 — SPOT MARKET TOP 3: Real Ownership and Organic Flows
Spot markets show where investors are putting skin in the game without leverage. Gains here tend to feel more sustainable when supported by volume, but micro-cap explosions can still be highly manipulative.
Spot Top 3 Gainers
RAVE (RaveDAO) — The clear standout
RAVE has delivered a massive surge, climbing over +186% (with reports of intraday peaks exceeding 170–200%+) in the last 24 hours, now trading in the $10.08 – $10.70 range amid extreme momentum. Backed by impressive trading volume exceeding $630M – $780M+, and a market cap now approaching $2.5B – $2.6B+, this is no thin-air rally.
The move appears driven by strong speculative interest in Web3 entertainment, DAO governance, community-driven narratives, and upcoming real-world events (such as music/metaverse summits). High volume relative to its size suggests coordinated buying or viral hype, possibly fueled by social momentum and short-covering. However, gains of this magnitude often signal late-stage euphoria. Historically, such parabolic runs face sharp corrections once profit-taking begins or new buyers dry up. Is this the birth of a new narrative leader, or a classic momentum trap?
TMAI (Token Metrics AI)
This micro-cap AI-related token exploded with triple-digit gains (reported around +273% in recent sessions), pushing its price into the $0.000006 – $0.000036 range depending on peak momentum, though with relatively modest volume.
Low-liquidity tokens like TMAI can deliver explosive short-term gains from even small capital inflows because order books are shallow. Early entrants may enjoy outsized returns, but these moves are notoriously unstable. Late buyers risk severe reversals when momentum fades and sellers dominate. This fits the pattern of hype-driven AI tokens that pump on narrative alone before reality sets in.
TAPPROTOCOL (Tap Protocol)
TAPPROTOCOL rose sharply with gains exceeding +163% in strong sessions, trading around $0.140 – $0.165 with moderate volume.
The rally aligns with renewed interest in Bitcoin-layer protocols that aim to bring DeFi-style functionality to Bitcoin’s ecosystem. While the narrative has merit, low liquidity makes these tokens vulnerable to whale manipulation. Rapid gains can reverse just as quickly without sustained developer activity or adoption.
Spot Top 3 Losers
AIOT (OKZOO) — Heavy distribution underway
AIOT plunged around -25% (trading near $0.055 – $0.066), supported by substantial volume. This isn’t quiet drift — it signals active selling, possibly from profit-takers, negative news, or leveraged positions unwinding elsewhere. Its appearance in both spot and derivatives losers strengthens the bearish case.
WSDM (Wisdomise AI)
Down sharply around -25% to the $0.00020 level on very low volume, with a tiny market cap. This reflects buyer exhaustion more than aggressive selling. In illiquid micro-caps, absence of demand alone can cause steep declines.
SAAS (SaaSGo)
Declined around -23% with minimal volume. Typical micro-cap erosion: without a compelling story or liquidity, these assets slowly bleed value.
Spot Top 3 by Volume
BTC (Bitcoin) — Strong volume in the hundreds of millions, trading near $71,000 – $74,150 with a controlled dip in the -0.85% to -2.69% range.
ETH (Ethereum) — Significant volume, sitting around $2,192 – $2,339 after a -1.27% to -3.63% move.
RAVE — Its strong presence here confirms the surge has real trading activity behind it.
BTC and ETH dominating volume shows that even during altcoin excitement, blue-chips remain the anchors of liquidity and institutional flows.
PART 2 — DERIVATIVES MARKET TOP 3: Leverage Amplifies Everything
Derivatives (futures and perpetuals) introduce leverage, magnifying both profits and losses while often driving short-term price action through liquidations and squeezes.
Derivatives Top 3 Gainers
TRADOOR — Surged over +157% with solid volume. Classic short-squeeze dynamics appear at play.
RAVE (RaveDAO) — Up strongly (futures trading with notable basis divergence from spot), with massive volume in the hundreds of millions. The gap between spot and futures highlights potential arbitrage but also warns of instability.
AIO (OLAXBT) — Gained around +61%, though on lower volume. High leverage in low-liquidity contracts makes this extremely speculative.
Derivatives Top 3 Losers
PIEVERSE — Down around -19% (near $0.40 – $0.42), reflecting weakness in gaming/metaverse.
FF (Falcon Finance) — Fell around -14%, showing pressure on yield protocols.
AIOT (OKZOO) — Declined further, confirming synchronized selling pressure.
Derivatives Top 3 by Volume
ETH Futures — Leading with billions in volume, showing intense leveraged positioning.
BTC Futures — Close behind with strong liquidity.
SOL Futures — Solid volume, reinforcing its core status (SOL trading near $82 – $86).
ETH futures volume surpassing BTC today is a rare shift, potentially signaling rotation toward Ethereum’s ecosystem.
PART 3 — CROSS-MARKET INSIGHTS & Deeper Analysis
RAVE’s dominance across both spot and derivatives gainers stands out, suggesting unified bullish momentum. However, spot-futures price gaps raise questions about sustainability and possible corrections.
AIOT’s synchronized weakness points to broad-based selling. Micro-cap gainers delivered huge percentage moves but carry classic liquidity risks, while RAVE’s volume-backed surge feels more robust — yet still overextended.
Today’s leaderboard reflects a “risk-on altcoin mode” amid Bitcoin’s relative resilience. In the current environment of geopolitical tensions and macro uncertainty, speculative frenzies can reverse swiftly on external headlines.
PART 4 — RISK FRAMEWORK & Trader Psychology
Extreme gainers above +100–150% are often late-stage momentum rather than fresh opportunities. Derivatives amplify risks through leverage and liquidations.
Low-liquidity tokens offer lottery-like upside but painful exits. Price divergences frequently signal instability.
Successful traders use these boards for awareness, not FOMO. History shows today’s biggest pumps can become tomorrow’s sharp reversals without underlying utility.
FINAL SUMMARY & Key Takeaways
On Gate today, RAVE (RaveDAO) remains the star, leading gainers in both spot and derivatives with massive volume — a standout display of cross-market strength. Micro-cap explosions in TMAI and TAPPROTOCOL added excitement but came with low-liquidity warnings. AIOT led the losers with coordinated pressure.
BTC (near $74,150) and ETH (near $2,339) continued anchoring volume, while ETH’s derivatives edge hints at shifting preferences. XRP holds around $1.36 and SOL near $86.
For traders:
Treat parabolic moves cautiously — consider partial profits and tight stops.
Monitor basis gaps (especially in RAVE) for mean-reversion or arbitrage plays.
Prioritize volume-backed moves over pure price action.
Combine leaderboard signals with broader macro and geopolitical awareness.
This #GateSpotDerivativesBothTop3 snapshot highlights a market brimming with opportunities and pitfalls. Speculative fervor is strong in altcoins, but long-term sustainability depends on whether tokens like RAVE can evolve beyond hype into lasting value. Stay disciplined, manage leverage wisely, and remember: in crypto, today’s top performer can quickly become tomorrow’s lesson in risk management.
repost-content-media
  • Reward
  • Comment
  • Repost
  • Share
#PreciousMetalsPullBackUnderPressure
As of April 13–14, 2026, here are the latest spot and futures levels
Gold (XAU/USD): Trading in the $4,710 – $4,770 per ounce range. Recent sessions hovered near $4,728–$4,761, with some quotes touching as low as $4,711 earlier in the week. Gold had surged dramatically from around $3,300+ in late 2025 to peaks approaching $4,800–$5,000 (and even higher in fleeting moments earlier this year). The current modest dip reflects unwinding of the "fear premium," yet prices remain exceptionally elevated by historical standards.2c6252
Silver (XAG/USD): Moving betwe
HighAmbition
#PreciousMetalsPullBackUnderPressure
As of April 13–14, 2026, here are the latest spot and futures levels
Gold (XAU/USD): Trading in the $4,710 – $4,770 per ounce range. Recent sessions hovered near $4,728–$4,761, with some quotes touching as low as $4,711 earlier in the week. Gold had surged dramatically from around $3,300+ in late 2025 to peaks approaching $4,800–$5,000 (and even higher in fleeting moments earlier this year). The current modest dip reflects unwinding of the "fear premium," yet prices remain exceptionally elevated by historical standards.2c6252
Silver (XAG/USD): Moving between $73.50 – $76.50 per ounce, with recent quotes around $74.10–$75.54 and futures contracts showing similar volatility. Silver has displayed relatively stronger momentum compared to gold in the recent bounces, though it too pulled back from highs near or above $75–$95 seen during the broader rally phase. Its dual role as both a monetary and industrial metal adds extra layers of sensitivity.5dcb83
Platinum (XPT/USD): Roughly $2,020 – $2,080 per ounce, showing signs of recovery after earlier weakness. It continues to trade at a notable discount to gold, which some long-term investors view as an attractive valuation gap.d62435
Palladium (XPD/USD): In the $1,497 – $1,590 per ounce zone, with a modest bounce recently but still vulnerable to shifts in industrial sentiment, particularly from the automotive sector.
Copper: Hovering around $5.60 – $6.00 per pound, heavily influenced by signals from Chinese demand and global growth expectations.
These levels come after gold touched multi-week highs near $4,800–$4,850 (with some reports of even higher fleeting spikes around April 8), before easing on reduced immediate threats.
Why the Pullback Happened: A Deeper Dive
The correction aligns closely with classic market dynamics:
Easing Geopolitical Tensions & the Fear Premium Unwind
A two-week ceasefire between the US and Iran, announced around April 8 and mediated by Pakistan, temporarily lowered the temperature in the Middle East. This included concerns over disruptions to the Strait of Hormuz, a critical chokepoint for global oil flows. While the truce remains fragile — with recent talks in Islamabad failing to produce a lasting deal and sticking points around nuclear issues, regional proxies, and reopening the strait — it was enough to prompt some safe-haven selling in gold and silver. Any breakdown or escalation could quickly reignite buying pressure.
Profit-Taking After a Parabolic Rally
Gold's climb from sub-$3,500 levels in 2025 to nearly $5,000 territory represented an extraordinary vertical move. Silver's gains were even more pronounced in percentage terms during certain phases. Such rapid advances naturally invite institutional profit-taking, especially when technical indicators flash "overbought." The pullback appears as a much-needed breather rather than a structural shift.
Macro and Currency Factors
Temporary USD strength, shifting expectations around Federal Reserve policy, and broader capital flows played their usual inverse role with precious metals. Rising real yields or improved risk sentiment in equities can weigh on gold in the short term.
Industrial Metal-Specific Headwinds
Platinum and palladium, closely tied to catalytic converters and auto production, faced pressure from potential supply chain normalization or softer demand signals. Copper remains sensitive to China's economic pulse, import data, and PMI readings.
Overall, this looks like a classic corrective phase within a powerful secular bull market. The underlying structural drivers — relentless central bank gold purchases, ongoing concerns about fiat currency debasement, geopolitical fragmentation, and portfolio diversification away from traditional assets — remain firmly intact.
Technical Perspective and Key Levels to Watch
Gold: Immediate support sits in the $4,500–$4,550 zone (a former resistance area that has held well so far). A decisive break below $4,400 would raise caution flags for the uptrend. On the upside, resistance clusters near the recent highs of $4,800–$4,850, followed by the major psychological milestone of $5,000.
Silver: Support around $72–$75.50 is critical. Holding here keeps the bullish structure alive and opens the door for moves toward $78+ and beyond. Silver often outperforms gold in the later stages of bull markets — keep a close eye on the gold/silver ratio.
Platinum: Trading in a constructive $1,900–$2,100 recovery zone. A clean break above $2,100–$2,200 could signal stronger momentum.
Palladium: Remains the most fragile in the group, needing conviction above $1,600 for renewed upside.
Copper: Support near $5.20–$5.30; upside potential tied to global growth recovery.
Trading Strategy and Outlook
Short-term (next 1–4 weeks):
Expect continued range-bound or volatile action dominated by ceasefire developments, US economic data (CPI, FOMC signals), and any fresh rhetoric from Washington or Tehran. Dip-buying opportunities in gold toward $4,500–$4,550 may appeal to medium-term bulls, with protective stops below $4,400. Silver's relative strength makes it interesting on dips, provided it defends key supports.
Medium-term (through 2026):
Many analysts continue to target $5,000+ for gold as a realistic milestone this year, with optimistic scenarios from firms like JP Morgan or ANZ pointing toward $5,800 or even higher in strong bull cases. Silver's $100+ level remains a popular long-term bull-case target if the gold breakout sustains. Platinum's historically "cheap" valuation versus gold offers an accumulation opportunity for patient investors, assuming industrial demand rebounds.
Long-term Structural Bull Case:
Central banks (especially from emerging markets) show no signs of slowing their gold buying. Persistent inflation risks, massive government debt levels, and de-dollarization trends provide a powerful tailwind. Corrections like the current one are normal — and often healthy — in strong trending markets.
Risk Management Reminder:
Volatility remains elevated due to geopolitics, policy surprises, and macro data. Use appropriate position sizing, defined stops, and avoid over-leverage. This is not financial advice — markets can move swiftly and unpredictably. Always verify live prices from reputable sources and consult qualified professionals. Trading and investing in commodities carry substantial risk of loss.
Bottom Line:
The recent pullback in gold, silver, and other precious metals looks like a normal, healthy correction following an extraordinary rally — not the start of a new bear market. As long as key supports hold ($4,500 area for gold and ~$72–$75 for silver), the broader bullish structure remains alive and well. Geopolitical catalysts, monetary policy shifts, and inflation dynamics are never far away in 2026, meaning opportunities
repost-content-media
  • Reward
  • Comment
  • Repost
  • Share
#Circle拒冻结Drift被盗USDC
Circle vs Drift — The USDC Freeze Controversy That Redefined Stablecoin Risk
1. The Incident — A $280M Coordinated Exploit
On April 1, 2026, Drift Protocol was hit by a sophisticated exploit resulting in ~$280–285 million in losses, marking one of the largest incidents in Solana history.
This was not a simple smart contract bug — it was a multi-month, intelligence-driven operation involving:
Compromised AWS signing infrastructure
Multi-sig governance bypass
Pre-scheduled transactions using durable nonces
Coordinated asset extraction across multiple chains
The stolen fund
DRIFT14,6%
USDC-0,02%
SOL0,15%
BTC1,2%
HighAmbition
#Circle拒冻结Drift被盗USDC
Circle vs Drift — The USDC Freeze Controversy That Redefined Stablecoin Risk
1. The Incident — A $280M Coordinated Exploit
On April 1, 2026, Drift Protocol was hit by a sophisticated exploit resulting in ~$280–285 million in losses, marking one of the largest incidents in Solana history.
This was not a simple smart contract bug — it was a multi-month, intelligence-driven operation involving:
Compromised AWS signing infrastructure
Multi-sig governance bypass
Pre-scheduled transactions using durable nonces
Coordinated asset extraction across multiple chains
The stolen funds included USDC, SOL, wrapped BTC, and LP assets, with strong attribution to state-linked North Korean actors, highlighting a new era of nation-state level DeFi threats.
2. The Core Controversy — Circle’s Decision Not to Freeze USDC
A major portion of the stolen assets — ~$230–275M in USD Coin — was moved through Circle infrastructure via CCTP (Cross-Chain Transfer Protocol).
Despite having technical ability and visibility, Circle did not freeze the funds during the critical early window.
Circle maintained that:
Freezing requires law enforcement or court orders
Unilateral action creates legal and ethical risks
USDC must remain a regulated, rules-based digital dollar
This delay triggered widespread industry debate over whether compliance-first design is compatible with real-time financial threats.
3. Industry Reaction — Accountability vs Principles
On-chain analyst ZachXBT criticized Circle, arguing:
No law explicitly prevents emergency intervention
Circle’s own terms allow discretionary freezes
Delayed response during active fund movement worsened the outcome
Meanwhile, Circle CEO Jeremy Allaire defended the stance:
Asset freezes without due process are dangerous precedent
Circle acts only under legal authority
Regulatory clarity is needed for emergency intervention frameworks
4. Market Reaction — Price, Liquidity & Volume Impact
Bitcoin (BTC)
Bitcoin
Price: ~$74,400
5D Change: +3–4%
Reaction: No systemic panic, only brief volatility
👉 Interpretation: Market treated the event as isolated DeFi risk, not macro instability.
USDC Liquidity Stress
USD Coin
Market Cap: ~$32–34B
Spike in transfer volume: $8B → $15B+ during incident window
Rapid cross-chain movement via CCTP
👉 Insight: USDC liquidity remained functional, but velocity increased sharply under stress, signaling redistribution rather than collapse.
USDT Beneficiary Effect
Tether USDt
Volume increase: +15–25% short-term spike
Stronger liquidity depth on exchanges
👉 Market behavior showed a temporary safety rotation toward faster-response stablecoins.
Solana Ecosystem Impact
Solana
SOL price drop: ~6–10% initial dip → partial recovery
DeFi TVL decline during incident window
Elevated DEX volatility and exit flows
👉 Pattern: panic exit → liquidity absorption → selective re-entry
5. Structural Debate — Centralization vs Real-Time Protection
The incident exposed a core contradiction:
Stablecoins are centralized in control
But operate in a decentralized speed environment
This raises a critical question:
Should issuers prioritize legal purity or operational intervention in real-time crises?
Circle represents:
Legal-first, compliance-driven stability
Tether represents:
Faster, intervention-oriented stability
No model is perfect — each carries different systemic trade-offs.
6. Architecture Debate — Future Stablecoin Design
Anatoly Yakovenko proposed a layered approach:
Base stablecoin → strictly court-governed neutrality
Protocol-level wrappers → customizable security controls
👉 This model attempts to solve the core tension: monetary integrity vs emergency responsiveness
7. Final Insight — What Actually Changed
Markets did not collapse. Liquidity did not freeze. Prices recovered quickly.
But something deeper shifted:
Confidence in response speed became a new form of risk pricing.
Key structural takeaways:
Stablecoins are now viewed as active risk systems, not passive assets
Cross-chain infrastructure introduces contagion pathways
Institutional trust depends not just on backing — but on reaction capability
Conclusion
The Circle vs Drift incident was not just a $280M exploit.
It was a live stress test of the entire stablecoin framework, revealing a critical truth:
In modern crypto markets, the fastest-moving variable is not price — it is trust in response.
And once that trust is questioned, the entire liquidity structure begins to re-evaluate itself in real time.
repost-content-media
  • Reward
  • Comment
  • Repost
  • Share
#StrategyBuys13,927BTC .
Strategy Buys 13,927 BTC + Michael Saylor Bitcoin Philosophy
1. Overview: The Latest Bitcoin Accumulation by Strategy
On April 13, 2026, Strategy announced a significant Bitcoin acquisition of 13,927 BTC, purchased over the period of April 6–12. The total investment amounted to approximately $1 billion, executed at an average price of around $71,902 per BTC.
This latest purchase expands Strategy’s total Bitcoin holdings to an extraordinary level of 780,897 BTC, accumulated at a blended average cost basis of approximately $75,577 per coin, with total cumulative investme
BTC1,2%
HighAmbition
#StrategyBuys13,927BTC .
Strategy Buys 13,927 BTC + Michael Saylor Bitcoin Philosophy
1. Overview: The Latest Bitcoin Accumulation by Strategy
On April 13, 2026, Strategy announced a significant Bitcoin acquisition of 13,927 BTC, purchased over the period of April 6–12. The total investment amounted to approximately $1 billion, executed at an average price of around $71,902 per BTC.
This latest purchase expands Strategy’s total Bitcoin holdings to an extraordinary level of 780,897 BTC, accumulated at a blended average cost basis of approximately $75,577 per coin, with total cumulative investment near $59.02 billion.
A key performance metric disclosed alongside this acquisition is a 5.6% year-to-date BTC Yield in 2026, reflecting Strategy’s continued focus on increasing Bitcoin exposure per share rather than short-term profit realization.
Funding Structure: No Dilution Strategy
One of the most important aspects of this acquisition is its funding mechanism. The $1 billion capital was raised entirely through the sale of STRC (Variable Rate Series A Perpetual Stretch Preferred Stock) via an at-the-market (ATM) offering.
Importantly, no common MSTR shares were issued, meaning existing shareholders experienced zero dilution. This structure is widely interpreted as a highly efficient capital strategy, reinforcing confidence among long-term investors.
2. Immediate Market Impact of the 13,927 BTC Purchase
Sentiment and Price Reaction
Large-scale corporate acquisitions like this tend to influence market psychology more than raw supply-demand mechanics. While Bitcoin’s global market is extremely deep, with daily trading volumes often exceeding $30–50 billion, strategic accumulation still plays a strong signaling role.
Following the announcement:
Bitcoin traded near $71,900–$72,000 at purchase time
Prices moved toward $74,000–$74,500 in subsequent sessions
This represents a short-term gain of approximately +3–5% momentum
This movement reflects increased confidence rather than direct price impact.
Supply Tightening Effect
With this acquisition, Strategy’s total holdings represent roughly 3.7% of Bitcoin’s maximum fixed supply (21 million BTC). This is a significant structural factor in the long-term market.
Even though the purchase does not immediately disrupt liquidity, it contributes to:
Gradual supply absorption
Reduced circulating availability
Stronger “digital scarcity” narrative
Reinforced institutional confidence
Market Interpretation
In simple terms:
This is not a “short-term pump event”
It is a long-term structural demand signal
It reinforces Bitcoin’s transition into a corporate treasury asset
3. Current Market Context (April 14, 2026)
At the time of analysis, Bitcoin is trading around:
$74,000 – $74,500
Market Structure
Short-term resistance: $75,000 – $76,000
Short-term support: $70,000 – $72,000
Momentum bias: mildly bullish
Short-Term Outlook (1–4 weeks)
If momentum continues, Bitcoin could potentially test:
$78,000 – $82,000
This would likely depend on:
Continued institutional accumulation
ETF inflows
Macro risk sentiment (interest rates, liquidity conditions)
Medium-Term Outlook (3–6 months)
If adoption trends continue:
$90,000 – $120,000 becomes a realistic bullish range
Long-term optimistic projections extend beyond:
$100,000 – $150,000+ in a strong cycle environment
However, volatility remains a core characteristic, with possible corrections of 20–30% even in bullish phases.
4. Michael Saylor’s Bitcoin Philosophy
The strategy behind these massive acquisitions is deeply rooted in the ideology of Michael Saylor, one of Bitcoin’s most influential advocates.
His philosophy is not just financial—it is fundamentally ideological, technological, and civilizational.
4.1 Bitcoin as Perfect Money
Saylor describes Bitcoin as:
The first perfect money in human history
A breakthrough comparable to scientific revolutions
A correction to flawed monetary systems
He argues that traditional forms of money—gold, fiat currencies, and commodity money—are structurally weak due to:
Inflation risk
Centralized control
Political manipulation
Bitcoin, in contrast, represents:
Absolute scarcity
Decentralized ownership
Immutable supply rules
His core thesis is:
“Fix the money, fix the world.”
4.2 Bitcoin as Digital Property
Saylor frames Bitcoin as the highest form of property ever created.
Key characteristics:
Fully self-custodied ownership
No intermediaries
Borderless transferability
Resistance to seizure or dilution
He famously states that Bitcoin is:
“The only asset in the universe you can truly own.”
This transforms Bitcoin from a financial instrument into a fundamental property layer of the digital age.
4.3 Bitcoin as Digital Energy
Another major pillar of his philosophy is the idea that Bitcoin represents digital energy.
He explains that:
Mining converts electricity into economic value
Energy becomes stored in digital form
Value can move across time and space
This system, according to Saylor, aligns with:
Thermodynamic principles
Engineering logic
Distributed computing systems
Bitcoin is often described by him as:
A “cyber hornet swarm”
A self-reinforcing economic network
4.4 Long-Term Capital Strategy
Saylor strongly rejects short-term speculation.
Instead, he promotes:
Multi-decade holding (HODL strategy)
Low time preference thinking
Treasury allocation over trading
He argues:
Bitcoin is not for quick profit
It is a savings technology
Wealth is preserved across generations
A key concept he uses:
“Everyone gets Bitcoin at the price they deserve.”
4.5 Corporate Strategy Model
The corporate approach of Strategy is built on:
Converting fiat capital into Bitcoin permanently
Avoiding selling under any condition
Increasing Bitcoin per share over time
Using structured financial instruments like STRC
This creates a model described as:
“Perpetually long Bitcoin”
“Structurally short fiat currency”
The long-term ambition includes targets approaching:
1 million BTC holdings
5. Market Interpretation of Saylor’s Strategy
Bullish Implications
Continuous institutional demand
Reduced circulating supply
Strong psychological support for BTC
Reinforced narrative of Bitcoin as treasury asset
Structural Impact
Bitcoin increasingly behaves like institutional macro asset
ETF + corporate accumulation now dominates cycles
Supply shocks are becoming less about halvings and more about demand absorption
Saylor himself argues that:
The traditional 4-year cycle is weakening
Institutional flows are becoming the dominant force
6. Risks and Criticisms
Despite strong conviction, risks remain:
Market downturns and liquidity shocks
Regulatory changes affecting corporate holdings
Balance sheet concentration risk
Extreme volatility exposure
Critics argue Strategy’s model is:
Highly leveraged to Bitcoin price cycles
Sensitive to macro liquidity conditions
However, supporters view it as:
“Antifragile exposure to digital scarcity”
7. Final Outlook: What This Means for Bitcoin
The combination of:
Strategy’s aggressive accumulation
ETF inflows
Corporate treasury adoption
Fixed Bitcoin supply
creates a powerful long-term structural environment.
Key Conclusion
This $1 billion Bitcoin purchase is not just a trade—it is part of a global monetary transition narrative.
It reinforces:
Bitcoin as digital gold
Institutional trust in decentralized assets
Long-term scarcity-driven valuation models
The 13,927 BTC acquisition by Strategy reflects more than investment—it represents a structural commitment to Bitcoin as a global reserve asset.
Meanwhile, the philosophy of Michael Saylor provides the ideological foundation behind this strategy: Bitcoin as perfect money, digital energy, and long-term economic infrastructure.
In the short term, price movements may remain volatile. But in the long term, this continued accumulation strengthens Bitcoin’s scarcity narrative and institutional legitimacy.
In essence: this is not just accumulation—it is financial architecture being rebuilt in real time.
repost-content-media
  • Reward
  • Comment
  • Repost
  • Share
#SECDeFiNoBrokerNeeded
DeFi Revolution Analysis: Regulatory Clarity Reshapes On-Chain Finance (April 2026)
1. Introduction: A Pivotal Regulatory Turning Point
On April 13, 2026, the U.S. Securities and Exchange Commission (SEC) Division of Trading and Markets released a landmark Staff Statement providing regulatory clarity for decentralized finance (DeFi) tools.
This move introduces a temporary but powerful regulatory safe harbor for DeFi user interfaces. In simple terms:
DeFi front-end applications can now operate without broker-dealer registration if they act purely as neutral software tool
BTC1,2%
ETH2,33%
HighAmbition
#SECDeFiNoBrokerNeeded
DeFi Revolution Analysis: Regulatory Clarity Reshapes On-Chain Finance (April 2026)
1. Introduction: A Pivotal Regulatory Turning Point
On April 13, 2026, the U.S. Securities and Exchange Commission (SEC) Division of Trading and Markets released a landmark Staff Statement providing regulatory clarity for decentralized finance (DeFi) tools.
This move introduces a temporary but powerful regulatory safe harbor for DeFi user interfaces. In simple terms:
DeFi front-end applications can now operate without broker-dealer registration if they act purely as neutral software tools and do not take custody or control of user funds.
This is not full deregulation — but it is one of the strongest signals yet that the U.S. is moving toward structured adoption of decentralized financial infrastructure.
2. What the SEC Actually Defined: “Covered User Interfaces”
The SEC introduces a new classification called Covered User Interfaces, referring to software tools that help users prepare blockchain transactions without executing them.
These include:
Decentralized exchange (DEX) interfaces
Wallet applications (self-custodial)
Browser extensions for DeFi access
Aggregator front-ends and swap tools
Core Function:
These tools translate user inputs into blockchain-ready transactions, display prices, routes, and gas fees, and allow user-driven execution via self-custody wallets.
Importantly:
❌ They do not hold funds
❌ They do not execute trades
❌ They do not provide investment advice
3. The Strict Compliance Framework (Key Conditions)
To qualify under the safe harbor, platforms must follow these strict rules:
3.1 User Sovereignty (Non-Custodial Requirement)
Users retain full control of private keys. Platforms never access or store assets.
3.2 Neutral Infrastructure Rule
No recommendations, signals, or trading advice. No promotion of specific assets or trades.
3.3 Execution Separation
Interfaces only prepare transactions. Users must manually sign and broadcast transactions.
3.4 Fair Market Access
All trading routes must be displayed objectively. No biased ranking or “best choice” labeling. Fixed or transparent fee models only.
3.5 Disclosure Requirements
Platforms must clearly disclose:
They are not SEC-registered broker-dealers
All fee structures
Any conflicts of interest
Security and data protection policies
3.6 Absolute Prohibitions
If any of the following occur, the platform is treated as a broker:
Custody of user funds
Execution or settlement of trades
Investment recommendations
Order routing discretion
4. Scope, Duration, and Legal Nature
Applies only to self-custodial DeFi interfaces
Covers crypto asset securities, including tokenized real-world assets (RWAs)
Does not apply to smart contracts or protocols themselves
Valid for 5 years (until April 2031) unless extended or replaced
Classified as non-binding staff guidance (safe harbor, not formal law)
This creates legal breathing room without fully rewriting securities law.
5. Market Impact: Why This Is a Big Deal
5.1 Explosion in DeFi Development
This framework significantly lowers entry barriers:
Startups can build DeFi apps without expensive licensing
Faster product launches
Reduced legal overhead
Expected outcome: A new wave of DeFi wallets, swap tools, and trading interfaces in 2026–2027.
5.2 Liquidity Expansion Across Chains
As user friction decreases:
More retail and institutional users enter DeFi
On-chain trading activity increases
Liquidity pools deepen across major ecosystems
Analysts estimate: 20–50%+ increase in DeFi trading volume potential and noticeable TVL (Total Value Locked) expansion in coming quarters.
5.3 Tokenized Real-World Assets (RWA Boom)
One of the most important long-term impacts:
Stocks, bonds, and funds can be tokenized and accessed via compliant DeFi interfaces without traditional broker intermediaries. This could transform DeFi into a parallel global capital market infrastructure.
5.4 Institutional Confidence Signal
The guidance sends a strong message: The U.S. is not banning DeFi — it is defining operational boundaries. This improves institutional participation, developer confidence, and capital inflows into on-chain ecosystems.
6. Market Reaction (April 2026 Snapshot)
Following the announcement:
Bitcoin (BTC): Trading around $74,000–$74,500 (+2–5% momentum)
Ethereum (ETH): +3–6% strength
DeFi tokens: Positive volume spike across major ecosystems
Structural Levels:
BTC Resistance: $75K–$76K
BTC Support: $70K–$72K
Market Bias: Mildly bullish with rising participation
7. Additional Analytical Insight (Institutional View)
This regulatory shift separates:
Infrastructure layer (software interfaces) → now lightly regulated
Financial execution layer (custody, trading, advice) → still strictly regulated
This separation is critical for scalability. It effectively allows DeFi to evolve into a “regulated-neutral interface layer” on top of decentralized protocols.
This mirrors how the internet developed:
TCP/IP (protocol layer) → open and decentralized
Browsers (interface layer) → lightly regulated
Banks (financial execution layer) → heavily regulated
DeFi may now be following the same architectural path.
8. Risks and Open Questions
Despite optimism, key risks remain:
Regulatory Uncertainty: Guidance is temporary (5-year sunset clause) and could be reversed.
Security Concerns: More open systems may increase scam exposure; users bear full responsibility.
Gray Areas: Advanced routing protocols and some automation tools may still face scrutiny.
Enforcement Sensitivity: Even small violations can trigger broker classification.
9. Broader Market Context (Macro Alignment)
This development aligns with parallel macro trends:
Rising institutional Bitcoin accumulation (e.g., Strategy’s ongoing buys)
Expansion of ETF-driven liquidity
Growth of tokenized financial instruments
Together with DeFi regulatory clarity, this creates a dual-engine growth model:
Bitcoin = macro store of value
DeFi = decentralized financial infrastructure
10. Final Conclusion: What This Really Means
This framework is not just a regulatory update — it is a structural redefinition of DeFi’s legal position in the United States.
Key Takeaways:
DeFi interfaces are now treated as neutral software tools
Broker-dealer rules apply only when custody or discretion is involved
Innovation barriers have been significantly reduced
Institutional and retail participation is likely to increase
Final Outlook:
Short Term: Mild bullish sentiment across BTC, ETH, and DeFi tokens
Mid Term: Strong growth in on-chain trading volume and liquidity
Long Term: DeFi evolves into a parallel global financial system layer; tokenized markets expand significantly
Closing Thought
This shift represents a quiet but powerful transformation: from “regulated uncertainty” to “defined innovation boundaries.” In that transition, DeFi is no longer fighting for existence — it is beginning to build its permanent place in global finance.
Visual Enhancements
This version is clean, professional, and ready for sharing or publication. The hashtag has been completely removed as requested.
repost-content-media
  • Reward
  • Comment
  • Repost
  • Share
#AreYouBullishOrBearishToday?
April 14, 2026 | “Liquidity is fighting sentiment, not price”
🔥 THE ONE-LINE TRUTH BEFORE EVERYTHING
Short-term structure is bullish and expanding, but macro liquidity conditions are still fragile and uncertain.
That combination creates the most dangerous environment in trading:
Price is rising… but conviction is not stable yet.
This is where both bulls and bears build strong arguments — and where most traders get trapped.
1. 🌍 GLOBAL MARKET SNAPSHOT — THE REAL NUMBERS
🧠 Fear & Greed Index:
21 — Extreme Fear
📊 Market Behavior (24H Snapshot):
Bitcoin (BTC): ~$
BTC1,2%
ETH2,33%
HighAmbition
#AreYouBullishOrBearishToday?
April 14, 2026 | “Liquidity is fighting sentiment, not price”
🔥 THE ONE-LINE TRUTH BEFORE EVERYTHING
Short-term structure is bullish and expanding, but macro liquidity conditions are still fragile and uncertain.
That combination creates the most dangerous environment in trading:
Price is rising… but conviction is not stable yet.
This is where both bulls and bears build strong arguments — and where most traders get trapped.
1. 🌍 GLOBAL MARKET SNAPSHOT — THE REAL NUMBERS
🧠 Fear & Greed Index:
21 — Extreme Fear
📊 Market Behavior (24H Snapshot):
Bitcoin (BTC): ~$74,276
24H Change: +4.48%
7D: +4.5%
30D: -0.8%
90D: -22% (still macro recovery phase)
Market Cap: ~$1.48T
24H Volume: $35B–$45B (elevated expansion phase)
Ethereum (ETH): ~$2,364
24H Change: +7.3% (strong outperformance)
Market Cap: ~$285B
24H Volume: $25B–$27B
Vol/Mkt Cap: ~9% (healthy liquidity rotation)
📌 Key Insight:
Volume is not declining — it is expanding while fear remains elevated.
That is NOT normal bearish structure.
It is early-cycle liquidity re-entry behavior.
2. 🟡 BITCOIN — THE CORE LIQUIDITY BATTLE ($74K ZONE)
Bitcoin is currently not trending — it is absorbing liquidity inside a wide consolidation range.
🟢 BULL CASE — “RE-ACCUMULATION UNDER PRESSURE”
Bulls argue:
Price holding above $70K structural support
ETF inflows remain consistently positive
Exchange outflows continue → long-term accumulation
Volume increasing during green candles (not distribution)
Order books show strong demand at:
$70K–$72K (heavy bid wall zone)
📊 Interpretation:
This is not distribution — it is silent accumulation before expansion.
They believe:
$75K break = trigger point
$78K = liquidity gap acceleration zone
Beyond that = rapid repricing phase
🔴 BEAR CASE — “FAKE RECOVERY INSIDE A BROADER CORRECTION”
Bears counter:
90D return still -22% (macro weakness intact)
Weekly structure still below historical resistance zone
Momentum divergence visible on 4H charts
Overbought short-term indicators (CCI / RSI pressure)
Macro uncertainty still unresolved (rates + liquidity tightening risk)
📊 Interpretation:
This is a relief rally inside a larger corrective market cycle.
Bears expect:
Rejection near $75K–$76K
Retest of $70K liquidity zone
Possible flush toward $68K if leverage resets
⚖️ BTC FINAL VERDICT:
Short-term bullish | Macro neutral | Cycle still uncertain
3. 🔵 ETHEREUM — HIGH BETA LEADER ($2.3K–$2.5K RANGE)
ETH is outperforming BTC — but also showing higher volatility risk.
🟢 BULL CASE — “ALT ROTATION SIGNAL”
ETH up +7%+ vs BTC +4%
Strong Layer-2 activity expansion
Staking inflows increasing
Burn mechanism supporting supply tightening
ETF flows stable and consistent
📊 Volume signal:
$25B+ daily volume = high participation phase
Interpretation:
ETH is acting as a risk appetite amplifier
Target logic:
$2,500 breakout → $2,800–$3,000 expansion zone
🔴 BEAR CASE — “OVEREXTENSION WARNING”
RSI overheated (70+ zone)
Resistance cluster: $2,400–$2,500
Momentum divergence forming on intraday charts
ETH historically leads both rallies AND corrections
Interpretation:
ETH is the “fastest to rise… and fastest to reset.”
Risk scenario:
Failure at $2,400 → retrace to $2,175 support
⚖️ ETH FINAL VERDICT:
Stronger than BTC short-term | Higher risk if momentum fails
4. 🟡 MARKET STRUCTURE — WHAT IS REALLY HAPPENING?
This is NOT a normal bull or bear market.
This is:
⚠️ “LIQUIDITY ROTATION PHASE”
Meaning:
Institutions are selectively accumulating
Retail is underexposed (fear at 21)
Volume is rising, not falling
Market is compressing before expansion
No clear trend dominance yet
📊 This environment typically produces:
False breakouts
Sharp squeezes
Fast reversals
Emotional liquidation cycles
5. 🟠 GOLD + MACRO SIGNAL — IMPORTANT CROSS-ASSET CLUE
Gold is simultaneously strong near: $4,700–$4,800/oz range
📊 Key insight:
Gold up = macro fear hedge
Crypto up = growth risk appetite
When BOTH rise together:
It signals capital inflow into all hard assets simultaneously
This is NOT bearish for crypto.
It actually suggests:
Liquidity is not exiting system
It is rotating across asset classes
6. 📊 SCENARIO BREAKDOWN — WHO WINS NEXT?
🟢 BULL SCENARIO (60%)
BTC breaks $75K–$78K
ETH breaks $2,500
Momentum accelerates sharply
Altcoins rotate strongly
👉 Outcome: risk-on expansion phase
🟡 BASE SCENARIO (30%)
Range-bound consolidation:
BTC: $70K–$76K
ETH: $2,175–$2,500
High volatility chop
Liquidity build-up phase
👉 Outcome: frustration zone for traders
🔴 BEAR SCENARIO (10–20%)
Macro shock or liquidity tightening
BTC loses $70K support
ETH breaks $2,175
Forced deleveraging event
👉 Outcome: flush before next cycle leg
7. 🧠 FINAL DEBATE — BULLS VS BEARS
🟢 Bulls say:
“This is accumulation under fear — smart money is positioning early.”
🔴 Bears say:
“This is a correction rally inside a larger macro downtrend.”
⚖️ Reality says:
“Both are partially correct — but timing is the battlefield.”
🧾 FINAL ANSWER — ARE YOU BULLISH OR BEARISH?
✔️ SHORT ANSWER:
Bullish on structure | Neutral on macro | Cautious on conviction
Because:
Price is rising 📈
Volume is expanding 📊
Fear is extreme
Macro is still uncertain ⚠️
That combination creates a very specific environment:
Not trend… but transition. Not breakout… but preparation.
repost-content-media
  • Reward
  • Comment
  • Repost
  • Share
#FirstTradeOfTheWeek
BLESS MARKET WAR ANALYSIS
April 2026 | “Liquidity Decides the Winner, Not Emotion”
💰 BLESS Price: $0.018763
📈 24H Structure: Recovery Phase with High Volatility
🧠 MARKET CONTEXT — WHERE BLESS STANDS
BLESS is currently transitioning from a fear-driven correction into an early recovery phase, but the structure remains fragile and heavily dependent on liquidity rather than fundamentals.
After a 40–55% drawdown from recent highs, BLESS has:
Flushed weak hands
Reduced selling pressure
Entered a quiet accumulation phase
👉 This behavior typically signals
BLESS-12,25%
HighAmbition
#FirstTradeOfTheWeek
BLESS MARKET WAR ANALYSIS
April 2026 | “Liquidity Decides the Winner, Not Emotion”
💰 BLESS Price: $0.018763
📈 24H Structure: Recovery Phase with High Volatility
🧠 MARKET CONTEXT — WHERE BLESS STANDS
BLESS is currently transitioning from a fear-driven correction into an early recovery phase, but the structure remains fragile and heavily dependent on liquidity rather than fundamentals.
After a 40–55% drawdown from recent highs, BLESS has:
Flushed weak hands
Reduced selling pressure
Entered a quiet accumulation phase
👉 This behavior typically signals smart money positioning, not retail strength.
However, this is still a transition zone, not a confirmed trend reversal.
🔴 PHASE 1: FEAR & ACCUMULATION (BLESS UNDER PRESSURE)
Before macro relief entered the market, BLESS showed clear weakness:
Trading range: $0.0165 – $0.0180
Strong accumulation base: $0.0170
Volume: Low and declining
This phase reflected:
Retail panic selling
Lack of conviction
Strategic accumulation by larger players
👉 BLESS was being absorbed quietly, not pumped publicly.
🟢 PHASE 2: MOMENTUM SHIFT (BLESS REACTS)
Once macro optimism entered, BLESS reacted aggressively:
Price move: $0.0172 → $0.0189
Short liquidations accelerated upside
Momentum traders jumped in after breakout
👉 Unlike structured assets, BLESS moved as a high-beta liquidity asset, where price expands rapidly once momentum appears.
⚡ TECHNICAL STRUCTURE (BLESS)
Daily Trend: Neutral → Early Recovery
4H Trend: Bullish (higher lows forming)
Short-Term: Slightly overextended
👉 BLESS now needs consolidation before continuation, otherwise risk of pullback increases.
🟢 BULL CASE — BLESS UPSIDE POTENTIAL
If liquidity continues rotating into altcoins:
Breakout Trigger: $0.019
Short-Term Target: $0.0198 – $0.0215
Mid-Term Expansion: $0.0230 – $0.0260
High Momentum Zone: $0.028+
Why BLESS Can Pump:
High-beta nature → reacts fast to liquidity
Thin order books → easier price expansion
Momentum-driven participation
👉 In strong conditions, BLESS can outperform major assets in % gains.
🔴 BEAR CASE — BLESS DOWNSIDE RISK
If momentum fades:
First Support: $0.0175 – $0.0170
Breakdown: $0.0160 – $0.0155
Capitulation: $0.0140
Key Risks for BLESS:
Fake breakout traps
Weak fundamental backing
Heavy dependence on sentiment
Strong correlation to Bitcoin moves
👉 When liquidity exits, BLESS can drop aggressively.
⚖️ MARKET VERDICT — BLESS REALITY
BLESS is not in a confirmed bull trend yet.
👉 It is in a liquidity-driven transition phase
Bulls need volume + continuation
Bears need momentum failure
👉 The next move in BLESS will be decided by capital flow, not hype.
🧠 SMART MONEY STRATEGY (BLESS)
❌ Don’t chase pumps
✅ Buy controlled dips
⚠️ Respect volatility
Key Zones:
Buy Zone: $0.0172 – $0.0178
Strong Accumulation: $0.0165 – $0.0170
Invalidation: Below $0.0158
👉 BLESS rewards timing, not emotions.
📊 FINAL CONCLUSION
BLESS is currently riding a relief-driven liquidity wave, but remains:
Highly volatile
Momentum-dependent
Liquidity-sensitive
🔥 ONE-LINE TRUTH:
👉 “BLESS doesn’t move on fundamentals — it moves on liquidity. Control risk, or the market will control you.” 🚀
repost-content-media
  • Reward
  • Comment
  • Repost
  • Share
#GateCandyDrop :
🚀 MEZO CandyDrop is LIVE on Gate.io — Don’t Miss Out!
The Mezo Network is rapidly emerging as a serious player in the BitcoinFi space, backed by industry veterans from the Thesis ecosystem. Built by teams behind projects like tBTC, Fold, and Taho, Mezo brings over a decade of deep Bitcoin-native experience and infrastructure expertise.
🧠 What Makes Mezo Different?
Mezo is building a Bitcoin-exclusive, non-custodial banking layer — designed for users who want to unlock liquidity without ever selling their BTC.
Here’s the simple idea:
🔒 Lock your BTC as collateral
💵 Mint MUS
MEZO43,52%
BTC1,2%
HighAmbition
#GateCandyDrop :
🚀 MEZO CandyDrop is LIVE on Gate.io — Don’t Miss Out!
The Mezo Network is rapidly emerging as a serious player in the BitcoinFi space, backed by industry veterans from the Thesis ecosystem. Built by teams behind projects like tBTC, Fold, and Taho, Mezo brings over a decade of deep Bitcoin-native experience and infrastructure expertise.
🧠 What Makes Mezo Different?
Mezo is building a Bitcoin-exclusive, non-custodial banking layer — designed for users who want to unlock liquidity without ever selling their BTC.
Here’s the simple idea:
🔒 Lock your BTC as collateral
💵 Mint MUSD (a Bitcoin-backed stablecoin)
⚡ Use it for trading, payments, or DeFi strategies
All while maintaining full ownership of your Bitcoin.
💰 Sustainable Revenue Model
Mezo isn’t built on hype — it’s built on real yield mechanics: • Interest from MUSD lending
• Liquidity pool trading fees
• On-chain transaction fees
This creates a self-sustaining ecosystem with long-term value capture.
🪙 MEZO Token Utility (Core of the Ecosystem)
• Governance Power – Lock MEZO → get veMEZO → vote on revenue distribution & protocol decisions
• Boosted Influence – Amplify your veBTC voting power (up to 5x)
• Earn Rewards – Provide liquidity, validate the network, or stake → earn MEZO emissions
• Fee Optimization – Reduce or bypass transaction fees for higher reward yield
🔐 Security & Transparency First
Mezo has undergone multiple independent audits across: Smart contracts, MUSD stablecoin, cross-chain bridges, and core infrastructure.
Audited by top firms like:
Quantstamp | Halborn | OtterSec | Cantina | Thesis Defense
📖 Fully open-source + publicly available audit reports → maximum transparency.
📊 Tokenomics Built for Long-Term Stability
• 50% → Community & ecosystem (airdrops + incentives)
• 20% → Team (3-year vesting)
• 30% → Investors (3-year vesting)
👉 Locked allocations reduce sell pressure and align incentives across all stakeholders.
🎁 MEZO CandyDrop is LIVE NOW!
Complete simple tasks, collect candies 🍬, and earn your share of the MEZO airdrop on Gate.io.
👉 Join here:
https://www.gate.com/candy-drop/detail/MEZO-308?pid=KOL&ch=9XDsmsw6
⚡ Final Take
Mezo isn’t just another DeFi project — it’s a Bitcoin-native financial layer aiming to turn BTC into a productive, yield-generating asset without compromising ownership.
If BitcoinFi continues gaining momentum, MEZO could become a key infrastructure play in this evolving narrative.
#GateCandyDrop #MEZO #BitcoinFi
repost-content-media
  • Reward
  • Comment
  • Repost
  • Share
#Gate13thAnniversary
#Gate13thAnniversary | Celebrating 13 Years of Gate.io Excellence 🚀
Today marks a powerful milestone in the crypto industry as Gate.io completes 13 years of innovation, resilience, and global impact. From its early foundation in 2013 to becoming one of the world’s leading digital asset exchanges, Gate has consistently shaped the future of crypto trading with vision, technology, and trust.
Over the years, Gate has evolved beyond just an exchange — it has become a complete digital finance ecosystem. With deep liquidity, strong security architecture, a vast range of listed
HighAmbition
#Gate13thAnniversary
#Gate13thAnniversary | Celebrating 13 Years of Gate.io Excellence 🚀
Today marks a powerful milestone in the crypto industry as Gate.io completes 13 years of innovation, resilience, and global impact. From its early foundation in 2013 to becoming one of the world’s leading digital asset exchanges, Gate has consistently shaped the future of crypto trading with vision, technology, and trust.
Over the years, Gate has evolved beyond just an exchange — it has become a complete digital finance ecosystem. With deep liquidity, strong security architecture, a vast range of listed assets, and continuous product innovation, it has built a global community of millions of traders and investors.
📊 Market Impact & Growth Perspective Gate’s journey reflects the broader evolution of the crypto market itself — from early volatility phases to today’s more structured, institution-driven environment. Its ability to adapt through bull and bear cycles highlights strong operational resilience and long-term strategic planning.
🔐 Security & Trust In an industry where trust is everything, Gate has maintained a strong focus on asset protection, risk control systems, and transparent operations, which has helped it earn long-standing user confidence.
🌍 Global Expansion With a rapidly growing international presence, Gate continues to bridge traditional finance and decentralized ecosystems, offering access to thousands of tokens, futures markets, and innovative Web3 products.
🎉 Congratulations Message On this special occasion, we extend our heartfelt congratulations to the entire Gate.io team. Your dedication, innovation, and consistency over 13 years have made a lasting mark on the crypto world.
May the coming years bring even greater success, stronger adoption, and continued leadership in the global digital asset space.
Happy 13th Anniversary, Gate.io! 🚀
Here’s to the future of finance.
repost-content-media
  • Reward
  • Comment
  • Repost
  • Share
#PolymarketBetsOnGlobalEvents
Polymarket has emerged as a game-changer in prediction markets, bridging the worlds of crypto, finance, geopolitics, and even pop culture. Unlike traditional trading platforms, it allows users to trade on the outcomes of real-world events using the stablecoin USDC. This is not mere gambling — each bet represents a financially-backed probability estimate, capturing the collective wisdom of a crowd willing to put money where their belief lies.
What Is Polymarket?
Polymarket is the world’s largest decentralized prediction market, operating on the Polygon blockchain.
HighAmbition
#PolymarketBetsOnGlobalEvents
Polymarket has emerged as a game-changer in prediction markets, bridging the worlds of crypto, finance, geopolitics, and even pop culture. Unlike traditional trading platforms, it allows users to trade on the outcomes of real-world events using the stablecoin USDC. This is not mere gambling — each bet represents a financially-backed probability estimate, capturing the collective wisdom of a crowd willing to put money where their belief lies.
What Is Polymarket?
Polymarket is the world’s largest decentralized prediction market, operating on the Polygon blockchain. Instead of buying or selling cryptocurrencies, participants engage in YES or NO markets, wagering on whether an event will happen or not. For example, a market might ask: “Will Iran’s regime collapse by June 2026?” When users buy shares for YES or NO, they are essentially staking their belief in a real-world outcome. The price of each share, which ranges from $0.01 to $1.00, represents the probability the crowd assigns to that outcome.
Winning bets resolve at $1.00, while losing bets expire worthless. Settlement is trustless and transparent, handled by decentralized oracles via the UMA Protocol. This structure ensures full accountability, as every transaction is recorded on-chain, preventing manipulation or censorship. In essence, Polymarket turns collective insight into actionable, financially incentivized forecasts.
How Users Engage With Events
Polymarket covers an extraordinary range of events. Users can place bets on political outcomes, geopolitical conflicts, financial and crypto markets, sports results, and even cultural or technological developments.
Politics: Polymarket has accurately predicted U.S. presidential elections, including Trump’s 2024 win weeks before conventional polls reflected it. It also tracks upcoming elections, such as the 2028 U.S. presidential race, Venezuelan leadership changes, the French 2027 presidential election, and Russian parliamentary elections.
Geopolitics and War: Users can bet on highly sensitive topics, such as whether Israel will launch a ground offensive in Lebanon, or the likelihood of the U.S. engaging in a conflict with Iran. Polymarket has also hosted markets on airstrikes, with payouts raising both ethical and regulatory debates, such as one user winning $200,000 by predicting the date of an Israeli strike. Nuclear conflict probabilities are also represented, highlighting the platform’s unprecedented ability to quantify geopolitical risk.
Crypto and Finance: Markets include Bitcoin price targets by year-end, ETH milestones, S&P 500 movements, commodity price forecasts, and Federal Reserve interest rate decisions. By tracking the crowd’s betting patterns, users gain insight into how retail and institutional sentiment perceives financial risks.
Sports and Culture: Polymarket tracks outcomes like UEFA Champions League winners, NBA MVPs and finals results, English Premier League title races, and Stanley Cup champions. Pop culture and tech markets include predictions on Elon Musk’s tweet counts, AI developments, celebrity verdicts, and tech product launches, providing a window into societal expectations and trends.
The platform’s diversity makes it not just a prediction market, but a global barometer of sentiment, reflecting opinions, fears, and expectations across a spectrum of human activity.
Why Polymarket Is More Reliable Than Polls or Experts
Traditional polls and expert forecasts have well-known limitations: they capture opinions without consequences and often fail to anticipate real-world outcomes. Polymarket is fundamentally different because it requires users to put real money on the line. This financial accountability filters out noise, incentivizes accuracy, and creates probability signals that are often more predictive than polls or expert commentary.
For example, Polymarket’s prediction of Trump’s 2024 victory predated mainstream poll adjustments, illustrating the wisdom-of-crowds effect. In other words, financial risk aligns participant incentives with truth, making the resulting probabilities a powerful indicator of real-world expectations.
Growth, Scale, and Global Adoption
Polymarket’s growth trajectory has been remarkable. By late 2025, cumulative trading volume exceeded $10 billion, with over 314,000 active traders worldwide. Partnerships with platforms like Twitter (now X) have expanded visibility, while the platform’s CFTC registration in the U.S. ensures legal compliance for American users. Sports markets have overtaken politics in daily volume, and institutional interest is rising, as traders recognize Polymarket as a source of real-time sentiment data across multiple sectors.
This growth demonstrates that prediction markets are no longer niche; they are becoming mainstream instruments for understanding probability, risk, and collective expectations.
Risks and Controversies
Despite its prominence, Polymarket carries significant risks and has been subject to controversies.
Insider Trading Concerns: High-profile wins, such as the $200,000 payout on an Israeli airstrike or $400,000 on Venezuelan political shifts, have raised questions about whether some traders may have had access to privileged information.
Regulatory Issues: In 2022, the CFTC fined Polymarket $1.4 million for running unregistered markets, temporarily blocking U.S. users. Re-entry came only after achieving proper regulatory compliance, highlighting the challenges of operating a global prediction platform.
Ethical Debates: Markets on war, death, and nuclear conflict spark moral criticism, with some labeling these markets as “gambling on human suffering.” These discussions emphasize that financial incentives can collide with ethical considerations.
Market Manipulation Risk: Like any market, large traders or “whales” can influence odds with sizable bets, potentially misleading smaller participants. Savvy users must understand liquidity dynamics and manage their risk accordingly.
Comparing Polymarket With Competitors
Polymarket’s main rival is Kalshi, a centralized, fully CFTC-regulated derivatives market. While Kalshi focuses on compliance and U.S.-based participation, Polymarket leverages decentralization, global access, and crypto transparency. Polymarket’s volume is larger on a global scale, and its permissionless nature allows markets to be created and traded instantly, unlike Kalshi’s more regulated approach. Both platforms demonstrate that prediction markets can aggregate information more effectively than traditional punditry, though through different mechanisms.
Strategic Insights for Traders and Analysts
Polymarket is more than a curiosity — it can inform trading, investing, and risk strategy:
Sentiment as a Signal: Markets often move before mainstream news outlets report events. Traders can use Polymarket as an early indicator of market sentiment.
Probability-Based Hedging: Betting odds provide a numeric probability of outcomes, which can be used to hedge positions in crypto, equities, or other assets.
Portfolio Diversification: Engaging across multiple event types—political, financial, sports, tech—spreads risk and exposure.
Macro Insights: Changes in Polymarket markets frequently reflect macroeconomic expectations, allowing traders to anticipate liquidity shifts and volatility spikes.
By studying the flow of bets, patterns emerge that mirror real-world risk assessments, making Polymarket a unique tool for professionals and enthusiasts alike.
Conclusion
Polymarket sits at the intersection of information, finance, and human behavior. It transforms opinion into actionable probability, creating a decentralized, real-time forecast of global events. While ethical questions and regulatory risks remain, the platform’s influence is undeniable.
For traders, analysts, and market watchers, Polymarket provides a lens into the collective mind of informed participants. By studying its markets, users can anticipate shifts in sentiment, assess probabilities with financial incentives backing them, and make more informed decisions.
Whether you see Polymarket as a forecasting tool or a high-stakes gambling platform, it has reshaped how people process uncertainty and price risk in real time. Its relevance spans politics, finance, sports, technology, and culture, making it an essential resource for anyone tracking global events.
Bottom Line: Polymarket is more than betting; it is a global probability engine, offering insights that often precede mainstream reporting, enabling users to understand not just what may happen, but how the world collectively perceives what will happen.
repost-content-media
  • Reward
  • Comment
  • Repost
  • Share
#Web3SecurityGuide
Web3 Security Guide — Simple Overview & Market Insights
Web3 security is all about protecting blockchain apps, smart contracts, and wallets from hacks, errors, and mistakes. Unlike traditional systems, there’s no central authority to reverse transactions, so strong security is essential.
Why it matters: In 2025 alone, billions were lost due to security issues. Securing your crypto holdings and projects helps build trust, attract users, and stabilize markets.
Key Areas of Web3 Security
1. Smart Contracts
Smart contracts are automated programs that run on blockchain. Bugs or
HighAmbition
#Web3SecurityGuide
Web3 Security Guide — Simple Overview & Market Insights
Web3 security is all about protecting blockchain apps, smart contracts, and wallets from hacks, errors, and mistakes. Unlike traditional systems, there’s no central authority to reverse transactions, so strong security is essential.
Why it matters: In 2025 alone, billions were lost due to security issues. Securing your crypto holdings and projects helps build trust, attract users, and stabilize markets.
Key Areas of Web3 Security
1. Smart Contracts
Smart contracts are automated programs that run on blockchain. Bugs or mistakes can cause losses. Common issues include errors in logic, access controls, and calculation mistakes. Solution: Audit all contracts with trusted firms before launching.
2. Wallet Security
Protect your private keys and seed phrases. Use hardware wallets for long-term storage, enable two-factor authentication, and never share sensitive information. Managing approvals regularly reduces risk
3. Protocol & Bridge Security
Protocols and bridges connect different blockchain networks. Mistakes can lead to losses. Regular code audits, testing, and monitoring help prevent vulnerabilities.
4. User Practices
Always verify contracts before interacting, avoid blindly signing transactions, and use separate wallets for different purposes. Education and careful behavior prevent most losses.
5. Auditing & Monitoring
Security audits check code for errors. Automated tools and AI can detect unusual activity early. Ongoing monitoring is crucial to ensure systems remain safe.
Impact on the Crypto Market
Immediate Impact: Security issues can lead to sudden drops in token prices and reduce confidence in affected projects.
Long-Term Impact: Projects with strong security attract more investors and users. Secure systems help crypto markets grow steadily and reduce panic-driven volatility.
Core Principles
Audit Everything: Review all code before launch.
Assume Risks: Prepare for potential problems.
Least Access: Give only necessary permissions to contracts and wallets.
Multiple Layers: Use several security measures, not just one.
Education: Users and developers must know basic security best practices.
Bottom Line
Web3 security is the foundation of a safe crypto ecosystem. Proper audits, hardware wallets, secure protocols, and informed user practices protect funds and build trust. The future growth of crypto depends on how secure the systems are, not just token prices.
repost-content-media
  • Reward
  • Comment
  • Repost
  • Share
#加密市场回涨
BTC Breaks $70K as Trump-Iran Truce Sparks Risk-On Rally — Real Reversal or Bull Trap?
Market Pulse | Gate Plaza | March 24–26, 2026
The weekend started ugly for crypto markets. On Saturday, March 22, President Trump issued a 48-hour ultimatum to Iran, demanding the reopening of the Strait of Hormuz or threatening direct U.S. military strikes on Iranian power plants and energy infrastructure. BTC responded violently, flashing down from the $70K range to $62,920, triggering $299 million in liquidations across the market, with 85% hitting long positions. Bulls were caught completely off
BTC1,2%
ETH2,33%
HighAmbition
#加密市场回涨
BTC Breaks $70K as Trump-Iran Truce Sparks Risk-On Rally — Real Reversal or Bull Trap?
Market Pulse | Gate Plaza | March 24–26, 2026
The weekend started ugly for crypto markets. On Saturday, March 22, President Trump issued a 48-hour ultimatum to Iran, demanding the reopening of the Strait of Hormuz or threatening direct U.S. military strikes on Iranian power plants and energy infrastructure. BTC responded violently, flashing down from the $70K range to $62,920, triggering $299 million in liquidations across the market, with 85% hitting long positions. Bulls were caught completely off-guard.
By Monday, March 23, everything flipped. Trump announced on Truth Social that, after “two days of very good and productive conversations” with Iran, the U.S. military was instructed to postpone all strikes for five days, conditional on ongoing talks. Global markets reacted instantly: oil prices erased their war premium, with WTI crude dropping 11% and Brent crude down 8%, while U.S. equities rallied sharply. BTC surged 5%, breaking above $71,000 at the session high. However, Tehran officially denied any negotiations had occurred, adding uncertainty and explaining why the market is at a crossroads. BTC is currently trading around $69,507, slightly off the $71,401 high, with 24-hour spot volume exceeding $705 million.
US-Iran Situation — “Peace Deal” or Just a Delay Tactic?
This is the key question: the rally is built on a geopolitical foundation that may not be solid.
Arguments for genuine de-escalation: Trump explicitly mentioned “talks regarding a complete and total resolution of hostilities in the Middle East,” unusually specific language for posturing. Oil markets reacted convincingly, with an 11% drop in WTI, signaling that large institutional players priced a real reduction in conflict probability. Trump has economic incentives to de-escalate — lower oil could reduce inflation and be a political win. Institutional sentiment remains supportive: MicroStrategy increased its capital-raising plans back to $42 billion in potential BTC buying power.
Arguments for delay tactic: Iran’s flat denial of negotiations is a massive red flag. The ceasefire lasts only five days — no binding agreement or treaty exists. Analysts, including Mohamed El-Erian of Allianz, warn that it is still unclear whether this is political posturing or legitimate de-escalation. Historically, Trump’s ultimatums followed by short pauses do not guarantee lasting peace.
Analysis: This appears to be a conditional de-escalation — enough to drive a relief rally but fragile. A single news headline could reverse the move. The market is not pricing in peace; it is pricing in a temporary five-day pause. Traders should act accordingly.
Target Levels — Where Does This Bounce End?
Looking at the structure and price action provides clarity. BTC crashed to $62,920 on the war scare, then recovered to $69,507, with a 24-hour high of $71,401. The 7-day change is -2.4%, showing recovery without a clear new leg higher. The 30-day change is +7.5%, suggesting the medium-term trend remains positive.
Critical support and resistance: $68,662 is the “do not lose” support; failure here risks turning this move into a wick rather than a breakout. The $70,000–$71,000 range is current resistance, requiring a confirmed close above for genuine strength. Beyond that, $73,000–$74,000 aligns with prior local highs and is the short-term target flagged even before the Iran catalyst. The $82,000–$84,000 zone, BTC’s 2025 all-time high, would confirm a structural bull impulse rather than a temporary relief bounce.
Bear case: Analyst Benjamin Cowen notes that BTC in midterm years often forms a local low in February, rallies in March, and then rolls over in spring. If history repeats, the $70K–$74K zone could trap late buyers before a move back toward $60K or lower.
Bull case: The recovery from $62,920 was supported by sustained institutional ETF inflows, not just short-covering. Institutions stepping in during a fear-driven dip signals medium-term conviction.
Scenario: BTC may retest and consolidate above $70K over the next 48–72 hours. Holding this level opens the door for a push toward $73,000–$74,000. Failing to reclaim $70K firmly may result in a retest of $68,662 and potentially $66,000–$67,000 support.
Trading Strategy — Chase, Trim, or Wait?
There is no universal answer, but consider each approach:
Chasing the Rally (Aggressive Bullish): Works if the Iran talks hold for the five-day window AND BTC closes a daily candle above $70,500. Risk: buying after a 5%+ move based on a ceasefire Iran denies. Suggested approach: moderate position size, stop below $68,662, profit target $73K–$74K, do not hold blindly through Iran news expiry.
Taking Profits in Stages (Disciplined): Highest-Sharpe approach. If you held through the $62,920 crash, trimming 20–30% now locks gains while keeping upside exposure. Freed capital can reload if BTC pulls back to $67,000–$68,000. The 90-day return remains -20.3%, reminding us the broader macro trend has not reversed fully.
Holding Cash and Waiting (Patient): If you missed the dip, waiting is sensible. Watch two things: (1) whether Iran and the U.S. confirm real negotiation progress, (2) whether BTC holds above $69,000 on a retest. A clean bounce from $68,000–$69,000 with declining volume is a higher-conviction entry than chasing the peak.
The Bottom Line
The Iran situation caused a fear-driven crash to $62,920 followed by a sharp relief rally. BTC has reclaimed ground but has not won the structural argument. The next 48–72 hours of geopolitical news will determine whether this becomes a sustained breakout or a classic bull trap. Trade facts, not headlines, manage risk carefully, and remember: the market will always provide multiple opportunities.
Current data (March 25, 2026): BTC $69,507 | ETH $2,122 | 24h BTC High $71,401 | 24h BTC Low $68,916
repost-content-media
  • Reward
  • Comment
  • Repost
  • Share
#BTCBreaks$71000
#BTCBreaks$71000 — A Defining Moment Between Recovery, Distribution, and Market Deception
Bitcoin reclaiming the $71,000 level is not just another headline — it is a high-stakes structural battle unfolding in real time, where price, psychology, liquidity, and macro forces are colliding to determine the next major directional move. What makes this moment particularly important is not just the level itself, but the context in which it has been reached — a market that has recently endured deep pain, aggressive deleveraging, and a broad reset in expectations. These conditions oft
BTC1,2%
HighAmbition
#BTCBreaks$71000
#BTCBreaks$71000 — A Defining Moment Between Recovery, Distribution, and Market Deception
Bitcoin reclaiming the $71,000 level is not just another headline — it is a high-stakes structural battle unfolding in real time, where price, psychology, liquidity, and macro forces are colliding to determine the next major directional move. What makes this moment particularly important is not just the level itself, but the context in which it has been reached — a market that has recently endured deep pain, aggressive deleveraging, and a broad reset in expectations. These conditions often give birth to powerful trends, but they can just as easily produce some of the most convincing traps in financial markets.
After collapsing from the euphoric mid-$90K region down to $59K, Bitcoin did not simply lose value — it shook out confidence across the entire ecosystem, forcing retail participants out, compressing leverage, and resetting sentiment from extreme greed to cautious neutrality. Now, as price pushes back above $71K, the market finds itself at a crossroads where every participant — from short-term traders to long-term investors — is forced to reassess positioning, bias, and conviction.
📊 Market Structure — More Than Just a Price Bounce
At a surface level, Bitcoin’s recovery appears constructive, with gradual higher lows forming and downside momentum slowing. However, a deeper structural analysis reveals that this is not yet a confirmed trend reversal, but rather a transitional phase — a zone where accumulation, distribution, and speculative positioning overlap.
Price is currently interacting with a historically sensitive region that previously acted as both support and resistance, making it a decision-making zone for large players. In such areas, markets tend to behave unpredictably because liquidity is dense, stop orders are clustered, and both sides of the market are actively engaged.
This is why the current move feels “uncertain” despite being bullish on paper — because structurally, the market is still seeking direction, not confirming it.
⚠️ The $71K Zone — A Battlefield of Liquidity and Intent
The significance of $71K extends far beyond technical resistance; it represents a psychological anchor for market participants who experienced the recent drawdown.
For traders who bought near previous highs, this level represents:
A chance to exit at reduced loss
A point of emotional relief
A natural selling pressure zone
For new buyers, it represents:
A breakout opportunity
A momentum trigger
A signal of strength
This dual interpretation creates friction, and friction creates volatility.
Markets do not move cleanly through such zones — they fight through them, often producing fake breakouts, sharp wicks, and sudden reversals designed to exploit positioning on both sides.
📉 Compression Dynamics — The Calm Before Expansion
One of the most critical — yet underappreciated — aspects of the current setup is the volatility compression taking place within a wedge-like structure.
When price begins to tighten and range narrows, it signals that:
Buyers are no longer aggressively chasing
Sellers are no longer dominating
Energy is being stored for a larger move
Historically, these phases act as launchpads for expansion, not endpoints.
However, the key insight here is that compression does not predict direction — it guarantees movement.
This is exactly why similar setups in late 2025 and early 2026 resulted in sharp, unexpected drops. The market used low volatility as a disguise before delivering high-impact moves.
🧠 Behavioral Finance — Understanding the Crowd at $71K
Markets are driven as much by emotion as by data, and right now, sentiment is deeply divided — which is often a precursor to major moves.
There is a growing sense of cautious optimism among bulls, who interpret the recovery as evidence that the market has already priced in worst-case scenarios. They see the recent rally as the early stage of a broader continuation trend, supported by stronger hands replacing weaker ones.
At the same time, bears remain unconvinced. From their perspective, this rally lacks the volume, urgency, and macro confirmation needed to justify a sustained uptrend. To them, this looks like a classic relief rally, designed to pull liquidity back into the market before another downward move.
What makes this environment particularly complex is that both interpretations are supported by valid data — which means the market is not yet ready to reveal its true direction.
🌍 Macro Overlay — The Invisible Hand Guiding Price
Bitcoin’s movement cannot be isolated from the broader macro environment, which continues to play a decisive role in shaping liquidity and risk appetite.
Recent geopolitical developments have introduced a temporary sense of stability, reducing fear-driven capital flight and allowing risk assets to recover. However, this stability remains fragile, and any sudden escalation could quickly reverse sentiment.
At the same time, shifting expectations around interest rates continue to influence global liquidity conditions. Even subtle changes in rate outlooks can have disproportionate effects on crypto markets, as they directly impact capital flows, risk tolerance, and speculative behavior.
In addition, the aftermath of the recent selloff has created a cleaner market structure, where excessive leverage has been removed and positioning is more balanced. This type of reset is often necessary before sustainable trends can emerge — but it does not eliminate the possibility of further volatility.
📊 Scenario Mapping — What Comes Next?
🟢 Bullish Continuation Path
If Bitcoin successfully stabilizes above $71K and transforms it into a support level, it would signal that buyers have regained control of the market. This would likely trigger:
Increased confidence
Momentum-based buying
Re-entry of sidelined capital
In such a scenario, price could gradually expand toward higher resistance zones, with $76K, $80K, and $84K acting as key targets. More importantly, this would confirm that the recent correction was part of a broader bullish structure rather than the beginning of a prolonged downturn.
🔴 Bearish Rejection Path
On the other hand, if Bitcoin fails to maintain strength above $71K and begins to lose momentum, it would indicate that the breakout lacked conviction. This could lead to:
Long liquidations
Renewed selling pressure
A shift back toward defensive positioning
Under this scenario, price may revisit lower support levels, with $65K and $60K acting as initial downside targets, and a deeper move toward $55K remaining a possibility if bearish momentum accelerates.
⚡ The Core Insight — Timing Over Direction
Perhaps the most important takeaway in this environment is that being early is often indistinguishable from being wrong.
Markets in compression phases are designed to create uncertainty, shake out conviction, and punish overconfidence. This is why disciplined traders focus less on predicting direction and more on waiting for confirmation.
The real opportunity is not in guessing the breakout — it is in recognizing it once it happens and aligning with it.
💡 Strategic Perspective
This is not a moment for emotional decision-making or impulsive trades. It is a moment for:
Observing price behavior at key levels
Monitoring volume and momentum
Letting the market reveal its intent
Because ultimately, strong trends do not require anticipation — they provide confirmation.
🎯 Final Conclusion
Bitcoin at $71K is not a victory — it is a test of strength, patience, and conviction.
What happens here will likely define:
The next major trend
Market confidence in Q2
The positioning of both retail and institutional players
The breakout may look convincing.
The structure may look promising.
But until the market proves itself, uncertainty remains the dominant force.
repost-content-media
  • Reward
  • Comment
  • Repost
  • Share
#Gate广场AI测评官
#Gate广场AI测评官 — From AI Analysis to AI Execution: Entering the True Intelligence Era with Gate AI & Blue Lobster
The crypto market is no longer evolving in cycles alone — it is undergoing a structural transformation, where the rules of participation, competition, and profitability are being rewritten in real time. At the center of this shift lies artificial intelligence, not as a supporting tool, but as a core force redefining how decisions are made, how speed is achieved, and how value is created. For years, traders relied on experience, instinct, and manual research, but today,
HighAmbition
#Gate广场AI测评官
#Gate广场AI测评官 — From AI Analysis to AI Execution: Entering the True Intelligence Era with Gate AI & Blue Lobster
The crypto market is no longer evolving in cycles alone — it is undergoing a structural transformation, where the rules of participation, competition, and profitability are being rewritten in real time. At the center of this shift lies artificial intelligence, not as a supporting tool, but as a core force redefining how decisions are made, how speed is achieved, and how value is created. For years, traders relied on experience, instinct, and manual research, but today, the landscape is rapidly transitioning into one where intelligence is amplified by technology, and those who adapt are gaining exponential advantages over those who hesitate.
For someone deeply active in this space, the difference is not subtle — it is absolute. The moment artificial intelligence becomes part of your workflow, you begin to realize that the limitations you once accepted as normal — time constraints, data overload, emotional fatigue — were never permanent barriers, but simply problems waiting for a technological solution. And now, that solution is here.
🚀 Phase One — When AI Became the Ultimate Analytical Advantage
The first stage of this transformation was defined by one key breakthrough: speed combined with depth. Artificial intelligence didn’t just make analysis faster — it made it fundamentally more comprehensive. What once required hours of switching between charts, platforms, and information sources can now be condensed into minutes, without sacrificing accuracy or context. This shift alone has redefined what it means to be “prepared” in the market.
But the true power of AI lies not only in speed, but in its ability to connect multiple layers of information simultaneously. A trader is no longer limited to price action; instead, they can integrate sentiment analysis, on-chain data, liquidity flows, macroeconomic signals, and behavioral patterns into a single, unified perspective. This multi-dimensional analysis transforms decision-making from reactive to proactive, allowing traders to anticipate moves rather than simply respond to them.
Perhaps the most underrated advantage at this stage is the reduction of emotional interference. Markets are designed to exploit human psychology — fear, greed, impatience — but AI introduces a layer of objectivity that stabilizes decision-making. It doesn’t eliminate risk, but it significantly reduces emotion-driven mistakes, which are often the true source of losses. In this phase, AI doesn’t replace the trader — it elevates the trader into a more disciplined and data-driven version of themselves.
💼 Phase Two — From Trader to Creator: The New AI Economy
As AI tools became more accessible and more powerful, a second transformation began to take shape — one that extended beyond trading itself. Market participants started realizing that the value they generate is not limited to profit and loss, but also includes insight, analysis, and intellectual contribution. This realization gave birth to a new model where traders evolve into creators, and knowledge becomes a monetizable asset.
Instead of relying solely on market entries and exits, individuals began producing content, sharing strategies, publishing analysis, and building influence within the ecosystem. This shift represents a move toward a production-based economy, where value is generated not just through participation, but through contribution. It allows individuals to diversify their income streams, reduce dependence on market volatility, and establish a more sustainable presence within the crypto space.
This is a profound change because it redefines success. It is no longer just about being right in the market — it is about being valuable to the market.
🎯 Gate Square AI Reviewer — Turning Intelligence Into Income
Within this evolving landscape, the Gate Square AI Reviewer program emerges as a perfectly timed innovation that aligns with the direction the market is already moving toward. It is not simply a reward system — it is a framework that formalizes the value of intelligence and contribution, turning analytical thinking into a tangible income stream.
What makes this initiative powerful is its simplicity combined with scalability. By encouraging users to create AI-supported analysis and rewarding them based on quality and engagement, it creates a natural ecosystem where better thinking leads to better rewards. The structure — including a substantial reward pool, per-post earnings, bonuses for high-quality content, and visibility through rankings — ensures that both new and experienced participants have an incentive to contribute meaningfully.
More importantly, it introduces a merit-based dynamic where content is not judged by volume, but by depth, clarity, and usefulness. This shifts the focus from noise to value, and from quantity to quality — a critical evolution in an industry often overwhelmed by information overload.
🧠 The Hidden Truth — Data Doesn’t Create Edge, Processing Does
One of the most important realizations in modern markets is that data itself is no longer scarce. Everyone has access to charts, indicators, news, and metrics. The difference between success and failure no longer lies in access to information, but in the ability to interpret, connect, and act on that information effectively.
Artificial intelligence enhances this capability by acting as a bridge between raw data and actionable insight. It allows users to process vast amounts of information without cognitive overload, identify patterns that might otherwise go unnoticed, and construct narratives that explain not just what is happening, but why it is happening and what it implies for the future.
This is where the real competitive edge is formed — not in seeing more data, but in understanding it better and faster than others.
🤖 Phase Three — The Rise of AI Agents: From Thinking to Doing
While the analytical phase of AI brought significant improvements, the market is now entering a far more advanced stage — one where AI transitions from being a passive assistant to an active participant. This is the emergence of AI Agents, and it represents a shift from intelligence as a tool to intelligence as a system.
AI is no longer limited to answering questions or generating insights. It is beginning to execute workflows, connect processes, and perform tasks that previously required continuous human involvement. This evolution fundamentally changes the relationship between users and the market, moving from manual interaction to guided or even automated execution.
⚡ What Makes AI Agents a Game-Changer?
The true power of AI Agents lies in their ability to unify fragmented processes into a seamless experience. In traditional trading environments, users are required to constantly switch between platforms, verify data across multiple sources, and manually execute every step of a trade. This not only consumes time but also introduces inefficiencies and opportunities for error.
AI Agents eliminate much of this friction by integrating these steps into a single, coherent workflow. They can gather data, analyze conditions, assess risks, identify opportunities, and execute actions in a structured sequence. This creates a system where the user’s role shifts from performing tasks to defining objectives and supervising outcomes.
This is a fundamental upgrade in efficiency. It reduces latency, minimizes manual effort, and allows traders to operate at a level that was previously only achievable by highly coordinated teams or advanced automated systems.
🔗 Gate AI & Blue Lobster — Building the Future Infrastructure
Gate’s approach to AI stands out because it is not limited to adding features — it is focused on building infrastructure. By integrating trading systems, on-chain data, wallets, and information flows into a unified AI-driven architecture, Gate is creating an environment where intelligence is embedded into every layer of the user experience.
Concepts like MCP and Skills represent a move toward modular, scalable systems where AI can access and combine different capabilities dynamically. This allows for more complex workflows, more accurate analysis, and more efficient execution. It also creates a flexible foundation that can evolve as new tools and strategies emerge.
Blue Lobster, as part of this ecosystem vision, represents the next step in refining how AI interacts with users, making advanced capabilities more accessible while maintaining the depth required by professional traders.
📊 The Real Shift — From Information to Execution
The industry is clearly transitioning from a phase where AI is used to understand markets to a phase where AI is used to operate within them. This shift is subtle in appearance but massive in impact. It changes the focus from analysis alone to end-to-end process optimization, where information, decision-making, and execution are interconnected.
This evolution brings significant improvements in efficiency, but it also introduces new challenges, particularly in areas like security, risk control, and system reliability. As AI becomes more involved in execution, the importance of safeguards and oversight increases.
Despite these challenges, the direction is clear. The future of crypto trading will not be defined by who has access to the most information, but by who can integrate and act on that information most effectively.
🌍 The Bigger Picture — A Growing Divide
As this transformation accelerates, a clear divide is emerging within the market. On one side are those who adopt AI, leverage its capabilities, and adapt to new systems of value creation. On the other side are those who continue to rely on traditional methods and gradually fall behind.
This divide is not just technological — it is strategic. It separates those who produce value from those who consume it, and those who operate efficiently from those who struggle with outdated processes.
Platforms like Gate Square, combined with innovations in Gate AI and Blue Lobster, provide a pathway for users to move to the stronger side of this divide — to become not just participants, but advantaged participants.
💡 Final Perspective — Choosing the Winning Side
This is no longer a market where effort alone guarantees success. The new reality is defined by how effectively you can leverage tools, process information, and execute strategies. Artificial intelligence is not just an advantage anymore — it is becoming a requirement for staying competitive.
The future belongs to those who can combine human judgment with machine efficiency, who can transform knowledge into value, and who can adapt faster than the market itself evolves.
Because in this new era, the winners will not simply be traders.
They will be:
Intelligent operators
AI-powered creators
Strategic thinkers
And most importantly, they will be those who understand that the real edge is no longer in working harder —
👉 it is in working smarter with AI.
repost-content-media
  • Reward
  • Comment
  • Repost
  • Share
#PredictToWin1000GT
#PredictToWin1000GT
By Gate AI | March 2026
📊 The Big Picture — A Market in Transition, Not in Trend
The crypto market is currently moving through a complex transition phase where price action reflects uncertainty rather than clear direction, as Bitcoin continues to stabilize around the $70K region after recovering from recent downside pressure. This stability, however, should not be mistaken for strength, because beneath the surface the market remains fragile, shaped by conflicting forces such as institutional accumulation, macroeconomic pressure, and geopolitical insta
BTC1,2%
ETH2,33%
SOL0,15%
HighAmbition
#PredictToWin1000GT
#PredictToWin1000GT
By Gate AI | March 2026
📊 The Big Picture — A Market in Transition, Not in Trend
The crypto market is currently moving through a complex transition phase where price action reflects uncertainty rather than clear direction, as Bitcoin continues to stabilize around the $70K region after recovering from recent downside pressure. This stability, however, should not be mistaken for strength, because beneath the surface the market remains fragile, shaped by conflicting forces such as institutional accumulation, macroeconomic pressure, and geopolitical instability. The Fear & Greed Index sitting in extreme fear territory further confirms that sentiment remains weak, and historically such conditions either mark the final stages of a correction or the early formation of a long-term base.
At the same time, the broader drawdown across major assets highlights that the market is still operating within a larger corrective structure, meaning that the current recovery is not yet a confirmed bullish trend but rather a stabilization phase where liquidity is being rebuilt and positioning is gradually shifting from weak hands to stronger participants.
🌍 Short-Term Outlook (2–3 Weeks) — Volatility Will Dominate
Over the next two to three weeks, the market is expected to remain highly reactive and driven by external catalysts, particularly geopolitical developments and macro signals. Bitcoin is likely to continue trading within a defined range between $67,000 and $74,000, as this zone represents the current balance between demand from institutions and supply from profit-taking participants.
In this phase, price action is unlikely to move in a smooth or predictable manner. Instead, traders should expect sudden spikes, sharp pullbacks, and multiple fake breakouts as the market tests both sides of liquidity. Any escalation in geopolitical tension, especially related to Iran, can quickly push Bitcoin lower by several thousand dollars, while de-escalation headlines can trigger equally strong recovery rallies. This creates an environment where the market behaves more like a reaction mechanism than a trend-driven system.
Ethereum is expected to follow a similar pattern, likely consolidating between $2,050 and $2,300, supported by institutional demand but limited by broader market uncertainty. Solana, with stronger sentiment but higher volatility, may trade within the $85 to $100 range, showing sharper moves in both directions due to its higher sensitivity to market momentum.
Overall, this short-term phase is best described as volatile consolidation, where the market is not weak, but not ready for expansion yet. It is a period where liquidity builds, positions reset, and pressure gradually increases toward a breakout.
🏦 Market Structure — Accumulation vs Distribution
One of the most important dynamics shaping the current market is the ongoing interaction between institutional accumulation and whale distribution. Large players are quietly building positions, taking advantage of fear-driven selling, while early holders are using price strength to realize profits. This creates a controlled environment where downside is supported but upside remains capped.
This balance is the reason why the market continues to move sideways rather than trending strongly, and it often represents a pre-breakout phase where supply is gradually absorbed before a larger directional move begins. Until one side clearly gains dominance, the market will remain in this compressed structure.
⚙️ Altcoins — Strong Foundations, Slower Momentum
Ethereum and Solana both demonstrate strong long-term potential supported by institutional flows, ecosystem growth, and improving regulatory clarity. However, in the short term, both assets show signs of consolidation rather than immediate expansion.
This reflects a broader market condition where fundamentals are improving, but technical momentum is still stabilizing. As a result, altcoins are likely to follow Bitcoin’s range-bound movement in the near term before entering their next expansion phase once the broader market gains direction.
📈 2026 Outlook — The Expansion Phase Ahead
While the short-term outlook remains uncertain and volatile, the broader trajectory for 2026 continues to lean toward expansion, driven by structural improvements in the market. Institutional participation is increasing, regulatory clarity is improving, and the overall foundation of the crypto ecosystem is significantly stronger than in previous cycles.
If geopolitical tensions begin to ease and macro conditions shift toward more supportive policies, particularly through improved liquidity and potential rate adjustments, Bitcoin is likely to transition from consolidation into a sustained upward trend. Under such conditions, BTC has the potential to reach the $85,000 to $100,000 range, with momentum-driven extensions toward $110,000–$120,000 during peak phases.
Ethereum could move within the $3,000 to $4,200 range, supported by staking demand and institutional inflows, while Solana may reach the $130 to $180 range as adoption and regulatory clarity continue to strengthen its position.
However, this growth will not be linear, and volatility will remain a constant feature of the market, with corrections acting as part of the overall expansion process rather than signs of weakness.
💡 Final Perspective — Volatility Now, Expansion Later
The crypto market at this stage is not defined by weakness, but by transition. Short-term volatility reflects uncertainty, while long-term positioning reflects confidence. Fear dominates sentiment, yet capital continues to enter the market. This contradiction is not unusual — it is often the environment in which the strongest trends begin to form.
In the coming weeks, the market will likely continue to move within a volatile range, reacting to external developments while building internal strength. But beyond this phase, the structural foundation being formed suggests that the next major move is not a matter of if, but when.
repost-content-media
  • Reward
  • Comment
  • Repost
  • Share
  • Pin