Trade
Basic
Futures
Futures
Hundreds of contracts settled in USDT or BTC
Options
HOT
Trade European-style vanilla options
Unified Account
Maximize your capital efficiency
Demo Trading
Futures Kickoff
Get prepared for your futures trading
Futures Events
Futures Mall
Participate in events to win generous rewards
Demo Trading
Use virtual funds to experience risk-free trading
Earn
Launch
CandyDrop
Collect candies to earn airdrops
Launchpool
Quick staking, earn potential new tokens
HODLer Airdrop
Hold GT and get massive airdrops for free
Launchpad
Be early to the next big token project
Alpha Points
NEW
Trade on-chain assets and enjoy airdrop rewards!
Futures Points
NEW
Earn futures points and claim airdrop rewards
Investment
Simple Earn
Earn interests with idle tokens
Auto-Invest
Auto-invest on a regular basis
Dual Investment
Buy low and sell high to take profits from price fluctuations
Soft Staking
Earn rewards with flexible staking
Crypto Loan
0 Fees
Pledge one crypto to borrow another
Lending Center
One-stop lending hub
VIP Wealth Hub
Customized wealth management empowers your assets growth
Private Wealth Management
Customized asset management to grow your digital assets
Quant Fund
Top asset management team helps you profit without hassle
Staking
Stake cryptos to earn in PoS products
Smart Leverage
NEW
No forced liquidation before maturity, worry-free leveraged gains
GUSD Minting
Use USDT/USDC to mint GUSD for treasury-level yields
More
diznifigo
Bitcoin Regret Comes to Anyone Ignoring Coinbase CEO's 5% Rule as Banks Struggle to Limit Gains Advisers are building caps, rebalancing rules and the math of the decline in value, while crypto executives are selling avoiding regret as the new thesis. Coinbase CEO Brian Armstrong told Bloomberg in Davos that investors who don't have at least 5% of their net worth in Bitcoin are "probably going to be pretty sad" by 2030. Recently, Morgan Stanley's asset management division released portfolio guidelines that limit cryptocurrency exposure to a maximum of 4% for even their most aggressive growth mo
BTC1,11%
- Reward
- like
- Comment
- Repost
- Share
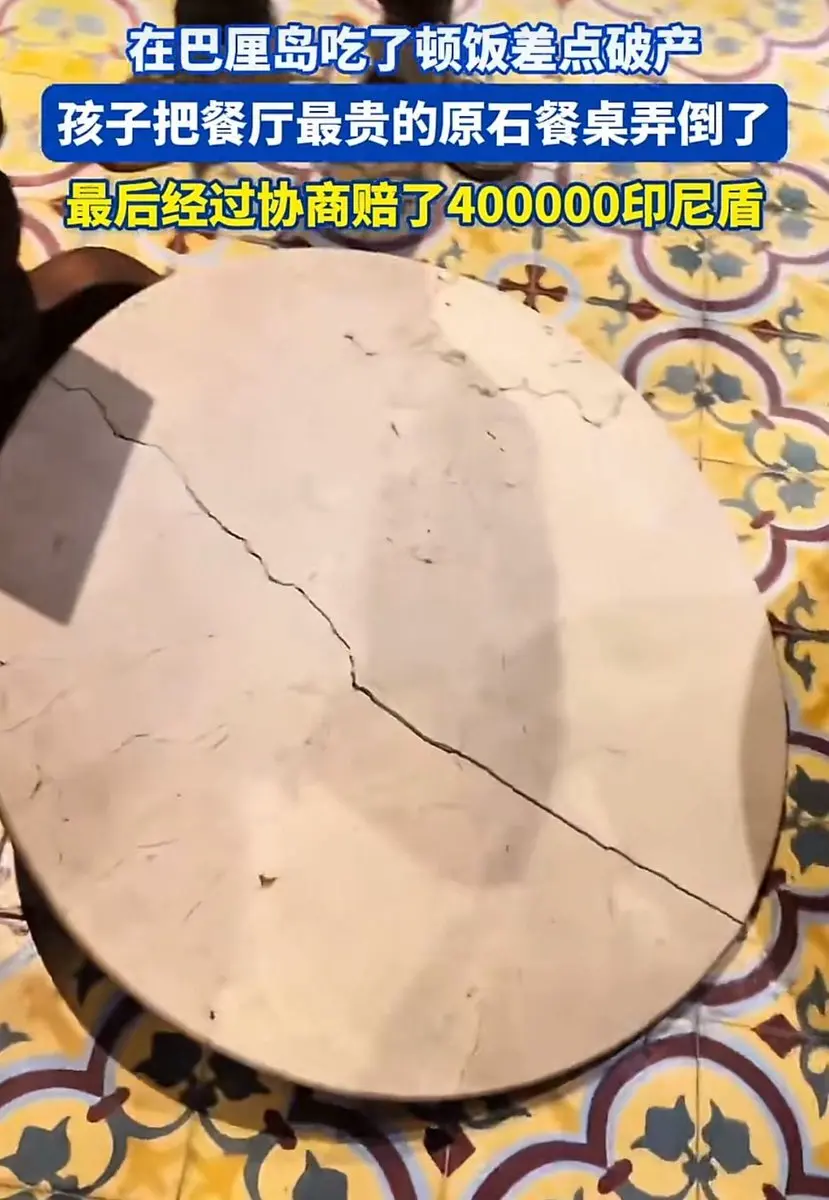
A Chinese tourist almost "broke the bank" while dining in Bali. He said that he nearly went bankrupt after damaging a raw stone dining table in Bali. A little girl accidentally knocked over the most expensive raw stone table in the restaurant. After continuous negotiations, he was asked to pay 400,000 Indonesian rupiah. Seeing so many zeros, he initially thought the owner was extorting him. After checking, he found out it was only about 165 RMB. Turns out, the owner was already very considerate. PS: Luckily, it wasn't in Qingdao, Hainan...
View Original
- Reward
- 1
- Comment
- Repost
- Share
MYJB
蚂蚁金币
Created By@MunanYiBufan
Listing Progress
100.00%
MC:
$8.6K
Create My Token
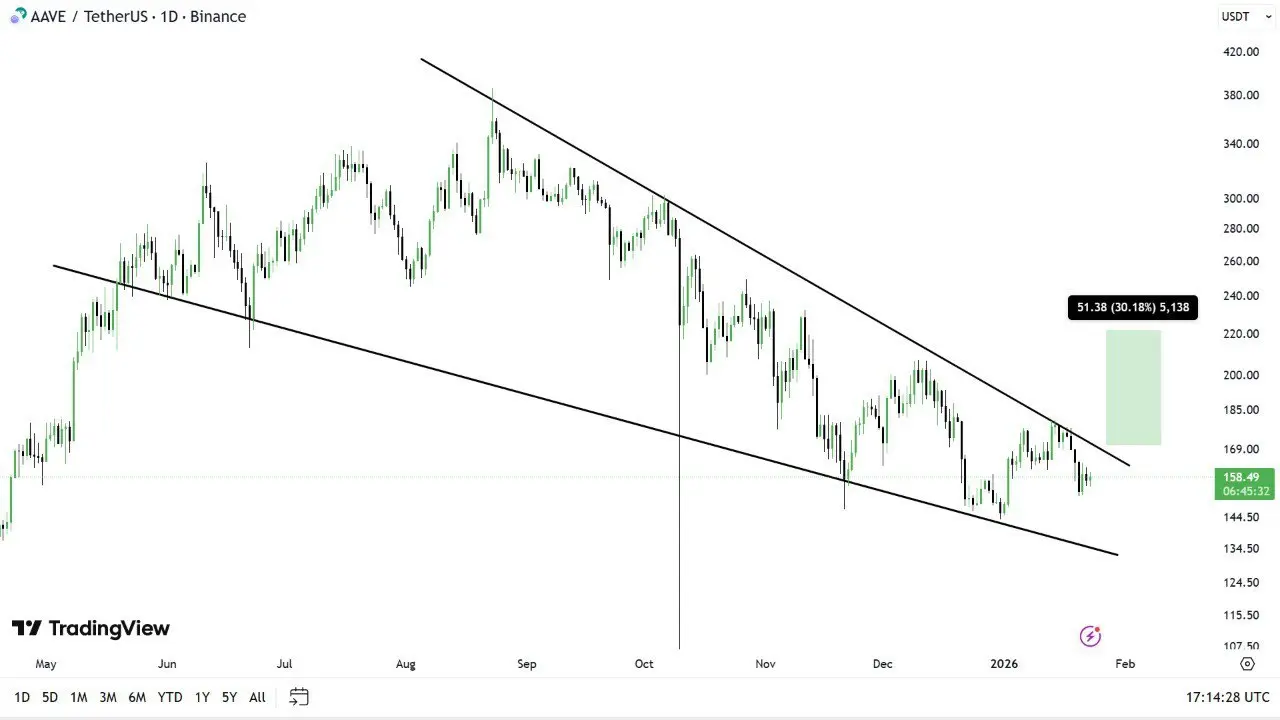
$AAVE looks primed right now 👀
It’s compressing inside a falling wedge on the daily, and pressure is clearly building for a breakout 📈
This one’s moving straight to the top of my watchlist structure says the move could come fast once it clears.
If it breaks clean, a 30% run in a short window isn’t unrealistic 💰
Definitely one to keep eyes on.
#ETHTrendWatch #GoldandSilverHitNewHighs
AAVE1,03%
- Reward
- like
- Comment
- Repost
- Share
My Gate 2025 Year-End Summary is here! See how I performed this year.
Click the link to view your exclusive #2025GateYearEndSummary and claim a 20 USDT Position Voucher. https://www.gate.com/competition/your-year-in-review-2025?ref=VQISVLLFVQ&ref_type=126&shareUid=U1ZFVltZCAUO0O0O
Click the link to view your exclusive #2025GateYearEndSummary and claim a 20 USDT Position Voucher. https://www.gate.com/competition/your-year-in-review-2025?ref=VQISVLLFVQ&ref_type=126&shareUid=U1ZFVltZCAUO0O0O
- Reward
- like
- Comment
- Repost
- Share
#TrumpWithdrawsEUTariffThreats
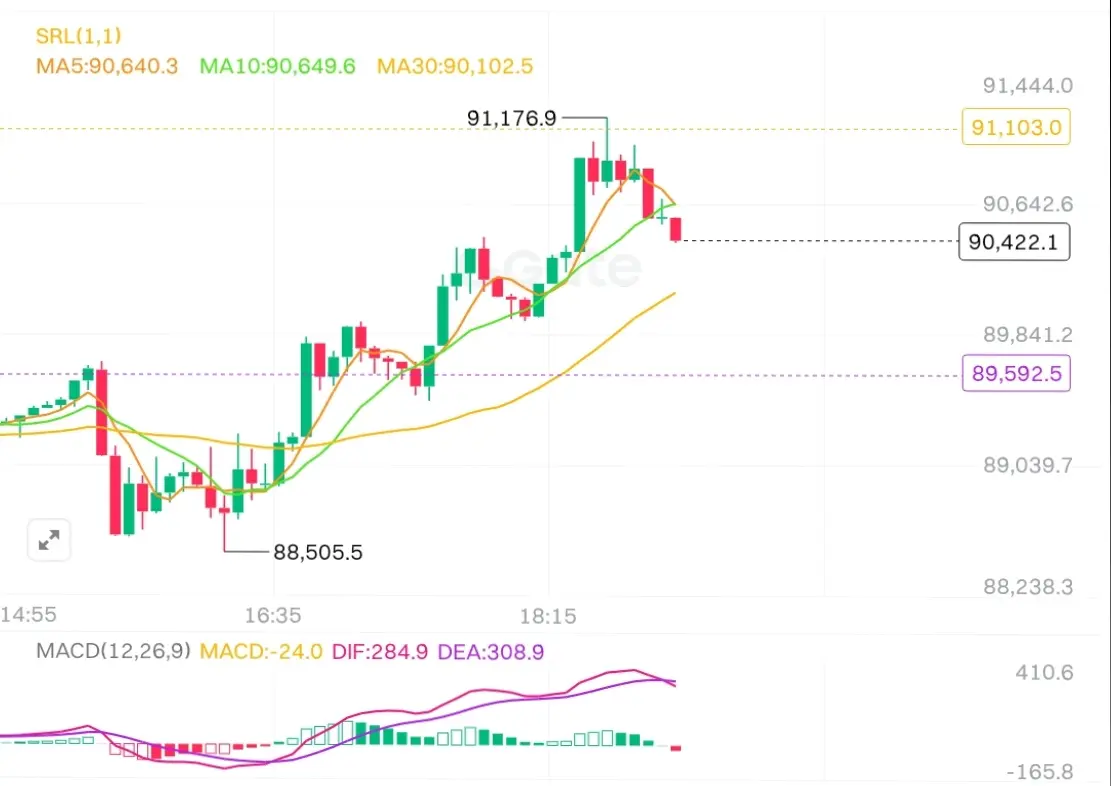
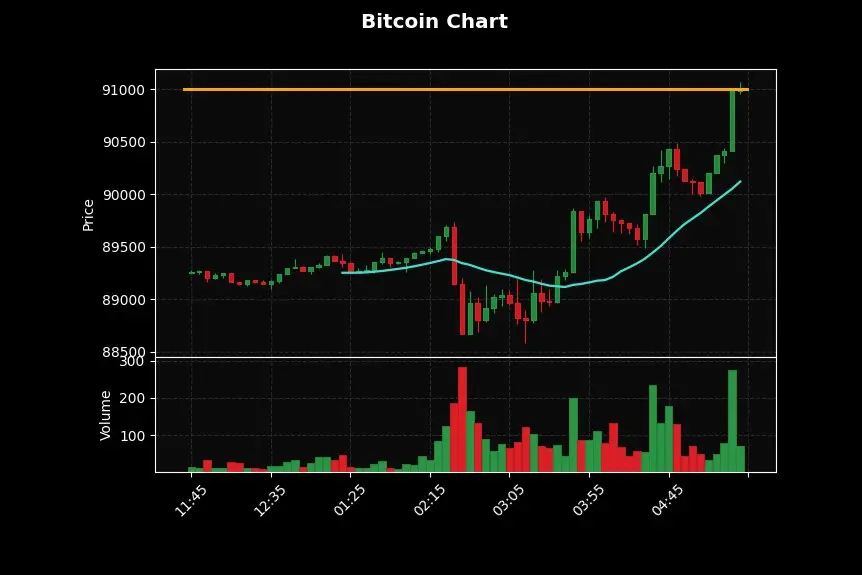
1. Price Action and Key Levels
The V-Shaped Recovery: The chart shows a significant "bottoming out" around the 88,505.5 mark (at approximately 15:55-16:15). This was followed by a sharp aggressive climb that peaked at 91,176.9.
Current Correction: We are currently seeing a pullback. The price is hovering around 90,422.1, which suggests the market is "cooling off" after the rapid 3% gain.
Support & Resistance:
Resistance: The 91,103.0 (yellow dashed line) is the immediate ceiling. The bulls failed to hold ground above this level.
Support: The purple dashed line a
- Reward
- 2
- 1
- Repost
- Share
HighAmbition :
:
2026 GOGOGO 👊#GoldandSilverHitNewHighs
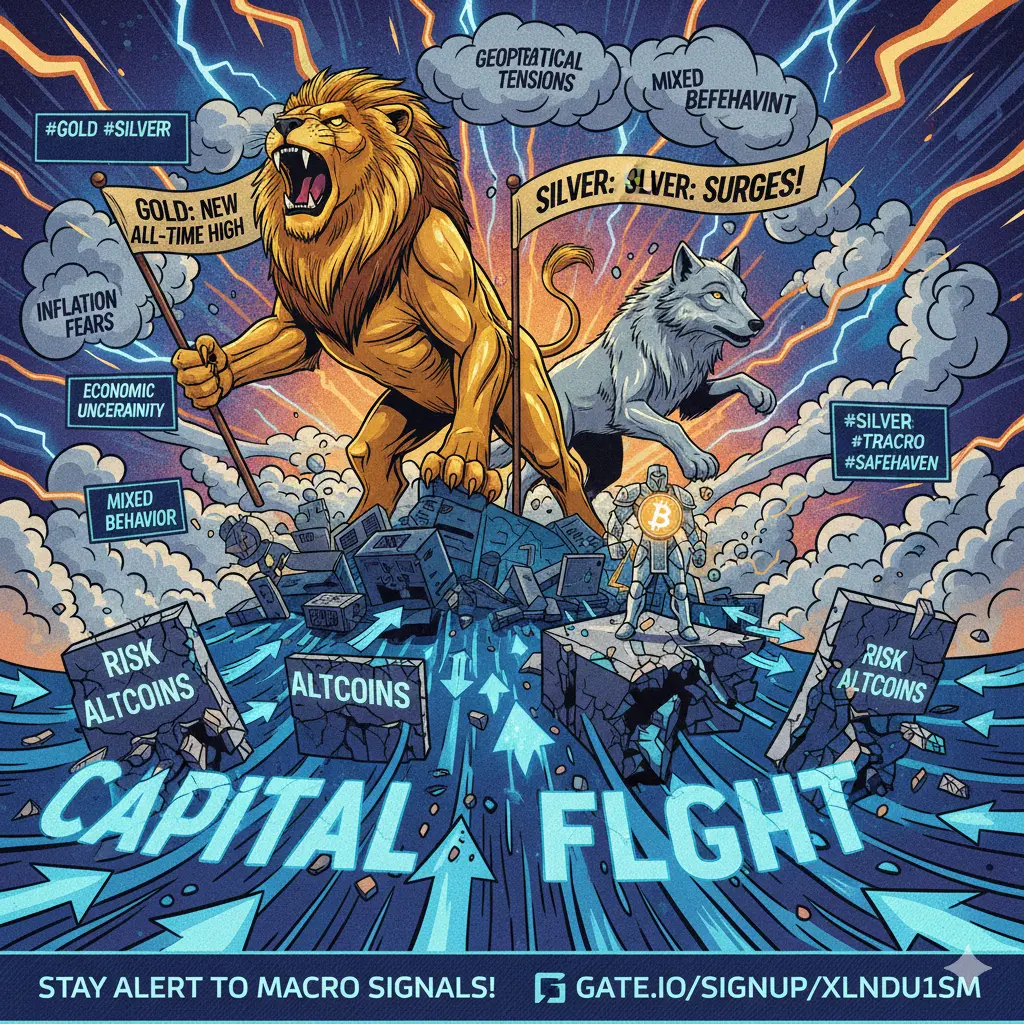
Gold and silver have surged to new highs, once again proving their role as classic safe haven assets during times of economic uncertainty. As global markets face rising volatility, investors are increasingly shifting capital toward precious metals to protect value and manage risk. This renewed strength in gold and silver is not happening in isolation, it reflects deeper macroeconomic pressures that are shaping sentiment across traditional finance and the crypto market.
One of the key drivers behind this rally is persistent inflation concern. Despite efforts by centra
BTC1,11%
- Reward
- 2
- 3
- Repost
- Share
KatyPaty:
Happy New Year! 🤑View More
Is this damn dead horse going to be taken down?
View Original
- Reward
- like
- Comment
- Repost
- Share
#GoldandSilverHitNewHighs ffghfdghjhcchhffjjddhjjhhffffhjjjkjugeadvdhjnxcvhhhhhhhhhhffhjnnbvdsdhhhhjgdsfhjjjjjjjjjjgfdhhjjjnbgdddhj


- Reward
- like
- Comment
- Repost
- Share
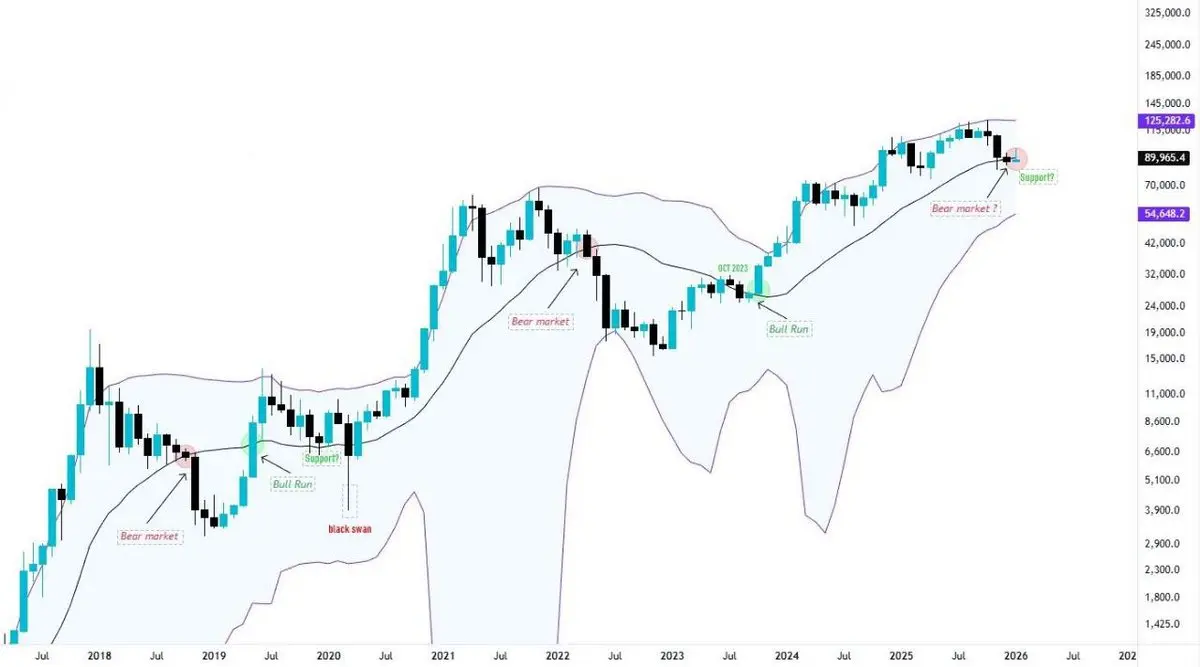
📊🤔 #BTC Price is currently #trading around the middle Bollinger Band. Historically, when price breaks above the middle Bollinger Band, #Bitcoin enters a strong #bullish phase. So far, price has tested the middle Bollinger Band for the first time this cycle, which is a key support level. A break below could trigger a massive correction and signal a bear market, while a successful hold could lead to a strong upside move. #CryptoMarket $BTC
BTC1,11%
- Reward
- like
- Comment
- Repost
- Share
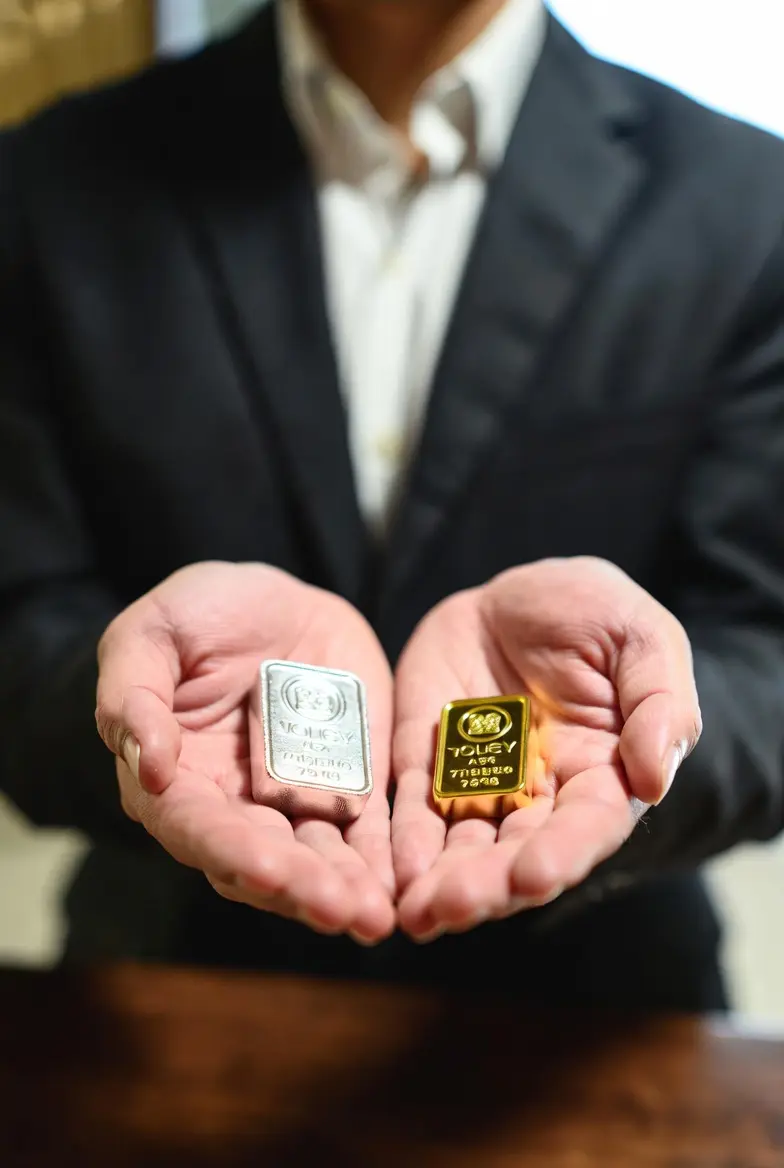
📊 Gold-Silver Ratio for the Last 10 Years (2016–2025)
The “gold/silver ratio” shows how many ounces of silver are needed to buy 1 ounce of gold and is an important indicator for both investors and economic data.
The following annual approximate trend summarizes the dynamics of change.
🔸2016 ~71:1
🔸2017 ~77:1
🔸2018 ~82:1
🔸2019 ~84:1
🔸2020 ~125:1 (pandemic peak)
🔸2021~72–80:1
🔸2022 ~80–90:1
🔸2023 ~80–90:1
🔸2024 ~85–105:1
🔸2025 ~95–100:1
🔸2026 (beginning)~50:1–60:1 (relative strengthening of silver)
#GoldandSilverHitNewHighs
#GateTradFi1gGoldGiveaway
$PAXG $SLVON $XAUT
- Reward
- 5
- 6
- Repost
- Share
xxx40xxx :
:
Happy New Year! 🤑View More
From now on, strict adherence to discipline and systematic execution is required!!
View Original
- Reward
- like
- Comment
- Repost
- Share
踏马起飞
踏马起飞
Created By@GateUser-2b85c4f8
Subscription Progress
0.00%
MC:
$0
Create My Token
#GoldandSilverHitNewHighs
🥇 My Experience with Gate TradFi Gold Lucky Bag 🥇
I recently participated in the Gate TradFi Gold Lucky Bag event, and honestly, the experience was smooth and rewarding. I placed my TradFi order, shared the screenshot on Gate Square, and the whole process was very simple and transparent.
What I really liked is that Gate is giving 1g of real gold every 10 minutes, which makes trading even more exciting. Along with that, there’s a chance to win position vouchers, which is a great bonus for active traders.
📊 My Trade Experience:
Order execution was fast
Interface fel

- Reward
- 1
- 1
- Repost
- Share
HighAmbition:
2026 GOGOGO 👊- Reward
- 1
- Comment
- Repost
- Share
Most people are unaware of the rate of acceleration we’re about to seeThink about it$NVDA\'s new Vera Rubin NVL72 will have 8 times the compute performance of the GB300Our best AI models, already taking on hundreds of thousands of jobs, were trained on computers that will soon look prehistoricNow, the rate of acceleration is such that NVIDIA was able to get that performance improvement in merely a yearImagine what models, applications, and advancements we’ll get once the largest AI labs get this new hardware in their handsNow, competition is accelerating, and that accelerates progress even fur

- Reward
- like
- Comment
- Repost
- Share
Load More
Join 40M users in our growing community
⚡️ Join 40M users in the crypto craze discussion
💬 Engage with your favorite top creators
👍 See what interests you
Trending Topics
View More30.51K Popularity
14.31K Popularity
9.2K Popularity
2.73K Popularity
5.82K Popularity
News
View MoreData: If BTC drops below $86,378, the total long liquidation strength of mainstream CEXs will reach $1.457 billion.
42 m
Data: If ETH drops below $2,848, the total long liquidation strength on mainstream CEXs will reach $953 million.
43 m
Data: 1,000 BTC transferred from an anonymous address, worth approximately $90.63 million
43 m
In the past hour, the entire network has liquidated $149 million, mainly short positions.
1 h
BTC breaks through 91,000 USDT
1 h
Pin