
**Date: **Sat, Jan 03, 2026 | 01:26 PM GMT
As 2026 kicks off, the broader cryptocurrency market is showing renewed stability. Ethereum (ETH) has reclaimed the $3,100 level, and several major altcoins are already beginning to pick up momentum. Against this improving backdrop, Kaspa (KAS) is quietly positioning itself as a potential late mover, with its chart structure starting to flash early bullish signals.
While KAS is trading slightly in the red today and remains mostly flat on the weekly timeframe, the more important story is unfolding beneath the surface. Recent price action suggests a meaningful structural shift may be underway — one that could mark the early stages of a bullish continuation if confirmed.
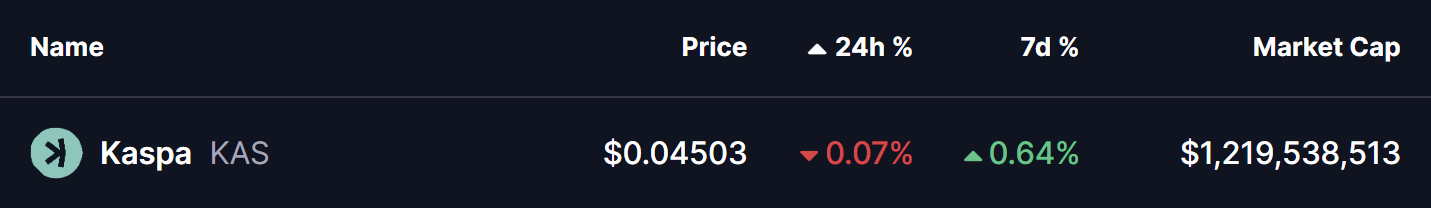
Source: Coinmarketcap
Rounding Bottom in Play
On the 4-hour timeframe, Kaspa appears to be forming a rounding bottom pattern, a classic bullish reversal structure that typically develops after a prolonged corrective phase. This pattern reflects a slow but steady transition from distribution to accumulation, as selling pressure weakens and buyers gradually regain control.
The setup began after KAS faced strong rejection near the $0.06310 neckline zone, which triggered a sharp decline through late November and December. That downside move eventually found strong demand near the $0.040 level, which has since acted as a key support area. Multiple defenses of this zone prevented further downside and helped establish a stable base for a potential trend reversal.
Since carving out that bottom, KAS has started to curve higher in a smooth, rounded fashion — closely matching the textbook structure of a developing rounding bottom. The recent stabilization above the $0.045 region further supports the idea that downside momentum is fading.
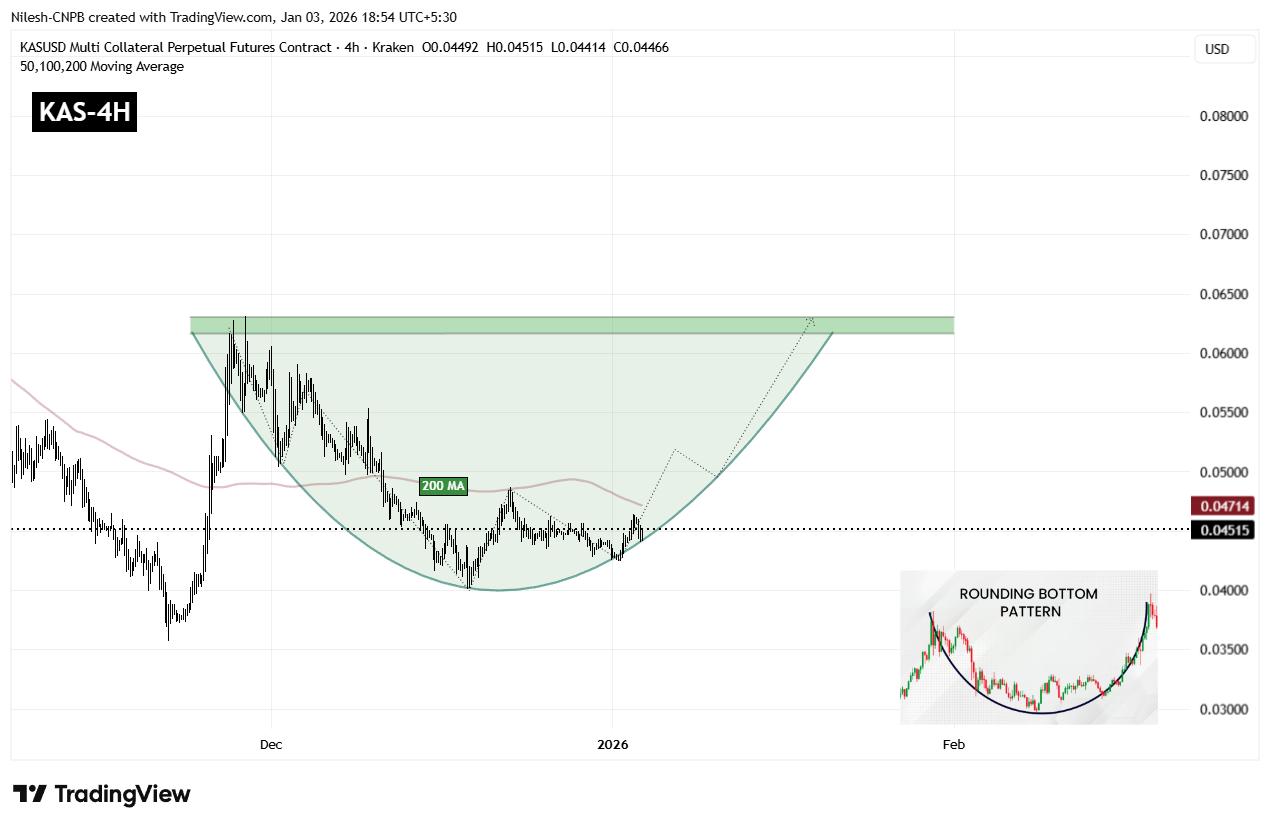
Kaspa (KAS) 4H Chart/Coinsprobe (Source: Tradingview)
A key technical level now comes into focus: the 200-period moving average, currently hovering near $0.04714. This level has acted as dynamic resistance during the recovery phase, and reclaiming it would mark an important shift in short-term market structure.
A sustained move above the 200 MA would indicate that buyers are regaining control after months of corrective price action and could act as the trigger for a stronger upside continuation.
What’s Next for KAS?
For full confirmation of the rounding bottom pattern, KAS must eventually reclaim the $0.06310 neckline resistance. A clean breakout above this zone would validate the entire reversal structure and could open the door to a broader bullish expansion phase, with momentum traders likely re-entering the market.
Until that breakout occurs, the pattern remains in development. Short-term consolidation or shallow pullbacks remain possible, especially near moving average resistance. However, as long as price continues to hold above the $0.04245 support base and maintains higher lows, the broader bottoming structure remains intact and constructive.
In the near term, all eyes remain on the 200 MA and the neckline zone. How Kaspa reacts around these levels will likely determine whether this emerging bullish setup evolves into a confirmed breakout move or requires more time to mature.
Disclaimer: The views and analysis presented in this article are for informational purposes only and reflect the author’s perspective, not financial advice. Technical patterns and indicators discussed are subject to market volatility and may or may not yield the anticipated results. Investors are advised to exercise caution, conduct independent research, and make decisions aligned with their individual risk tolerance.
About Author: Nilesh Hembade is the Founder and Lead Author of Coinsprobe, with over 5 years of experience in the cryptocurrency and blockchain industry. Since launching Coinsprobe in 2023, he has been providing daily, research-driven insights through in-depth market analysis, on-chain data, and technical research.
Disclaimer: The information on this page may come from third parties and does not represent the views or opinions of Gate. The content displayed on this page is for reference only and does not constitute any financial, investment, or legal advice. Gate does not guarantee the accuracy or completeness of the information and shall not be liable for any losses arising from the use of this information. Virtual asset investments carry high risks and are subject to significant price volatility. You may lose all of your invested principal. Please fully understand the relevant risks and make prudent decisions based on your own financial situation and risk tolerance. For details, please refer to
Disclaimer.
Related Articles
The Old Token Playbook Is Dead: Why Most Crypto Launches Failed in 2025
The old “token playbook” is over, according to 21Shares researcher Darius Moukhtarzade, who said that launching at high FDV, low float with a governance “meme coin” does not work anymore.
Moukhtarzade explained that there is a widening “sentiment-fundamentals gap” as the core reason behind
CryptoPotato7m ago
ETH 15-minute up 0.62%: Driven by ETF net inflows and a liquidity squeeze, short-term strength builds
2026-04-01 03:00 to 03:15 (UTC), the ETH price saw unusual movement, with a range return of +0.62%. The lowest point of the candlestick was 2088.43 USDT, and the highest point was 2106.93 USDT, with a swing of 0.89%. Against the backdrop of heightened volatility across crypto assets, ETH’s short-term trading activity was active, on-chain interest increased, and market attention rose significantly.
The main driver behind this unusual move is that net inflows into U.S. spot ETFs have continued to be amplified. ETF net inflows in early April continued the strong momentum from late March, driving a significant increase in spot demand for ETH.
GateNews59m ago
Is Bitcoin Approaching a Key “Buy Zone”? On-Chain Data Reveals That the Real BTC Bottom Signal Still Has Not Appeared
Bitcoin’s price is nearing the “buy zone” the market is watching, but the bottom signals have not fully formed yet. The current price is above the cost range, suggesting the market hasn’t undergone a major cleanup. The premium continues to narrow, reflecting that the bubble is being worked off. Although the market may face pressure in the short term, funds are positioning early, indicating optimism about future prospects.
GateNews1h ago
Analyst: Bitcoin supply structure is “changing hands”; whales and corporate trading are decoupling
XWIN Research’s analysis indicates that Bitcoin underwent a structural supply shift in the first quarter of 2026, with an increase in the exchange whale ratio. This suggests that large holders are selling Bitcoin, while publicly listed companies such as MicroStrategy have net-bought 62,000 Bitcoins. The market shows a dual trend of exchange whales and corporate accumulation: supply has shifted from early investors to companies’ balance sheets, and market liquidity has not improved significantly.
MarketWhisper1h ago
Bitcoin’s Most Dangerous Pattern Just Triggered: Will BTC Dump to $26K Next?
Although bitcoin has already dumped by over 50% from its all-time high of over $126,000 marked in October to a multi-year low of $60,000, the asset’s troubles might not be over, warned Merlijn The Trader.
The popular analyst indicated that the “most dangerous bitcoin pattern just completed phase
CryptoPotato2h ago
