Trade
Basic
Futures
Futures
Hundreds of contracts settled in USDT or BTC
TradFi
Gold
Trade global traditional assets with USDT in one place
Options
Hot
Trade European-style vanilla options
Unified Account
Maximize your capital efficiency
Demo Trading
Futures Kickoff
Get prepared for your futures trading
Futures Events
Participate in events to win generous rewards
Demo Trading
Use virtual funds to experience risk-free trading
Earn
Launch
CandyDrop
Collect candies to earn airdrops
Launchpool
Quick staking, earn potential new tokens
HODLer Airdrop
Hold GT and get massive airdrops for free
Launchpad
Be early to the next big token project
Alpha Points
Trade on-chain assets and enjoy airdrop rewards!
Futures Points
Earn futures points and claim airdrop rewards
Investment
Simple Earn
Earn interests with idle tokens
Auto-Invest
Auto-invest on a regular basis
Dual Investment
Buy low and sell high to take profits from price fluctuations
Soft Staking
Earn rewards with flexible staking
Crypto Loan
0 Fees
Pledge one crypto to borrow another
Lending Center
One-stop lending hub
VIP Wealth Hub
Customized wealth management empowers your assets growth
Private Wealth Management
Customized asset management to grow your digital assets
Quant Fund
Top asset management team helps you profit without hassle
Staking
Stake cryptos to earn in PoS products
Smart Leverage
New
No forced liquidation before maturity, worry-free leveraged gains
GUSD Minting
Use USDT/USDC to mint GUSD for treasury-level yields
More
GateUser-277db40a
Participate in horse racing betting, complete tasks to earn horse racing tickets, and enjoy a million red envelope rain daily, sharing a prize pool of 100,000 USDT at the Gate 2026 Spring Festival Celebration. https://www.gate.com/competition/year-of-horse-2026?ref_type=165&utm_cmp=7EQB9Jba&ref=AGDBU19C
View Original
- Reward
- 1
- Comment
- Repost
- Share
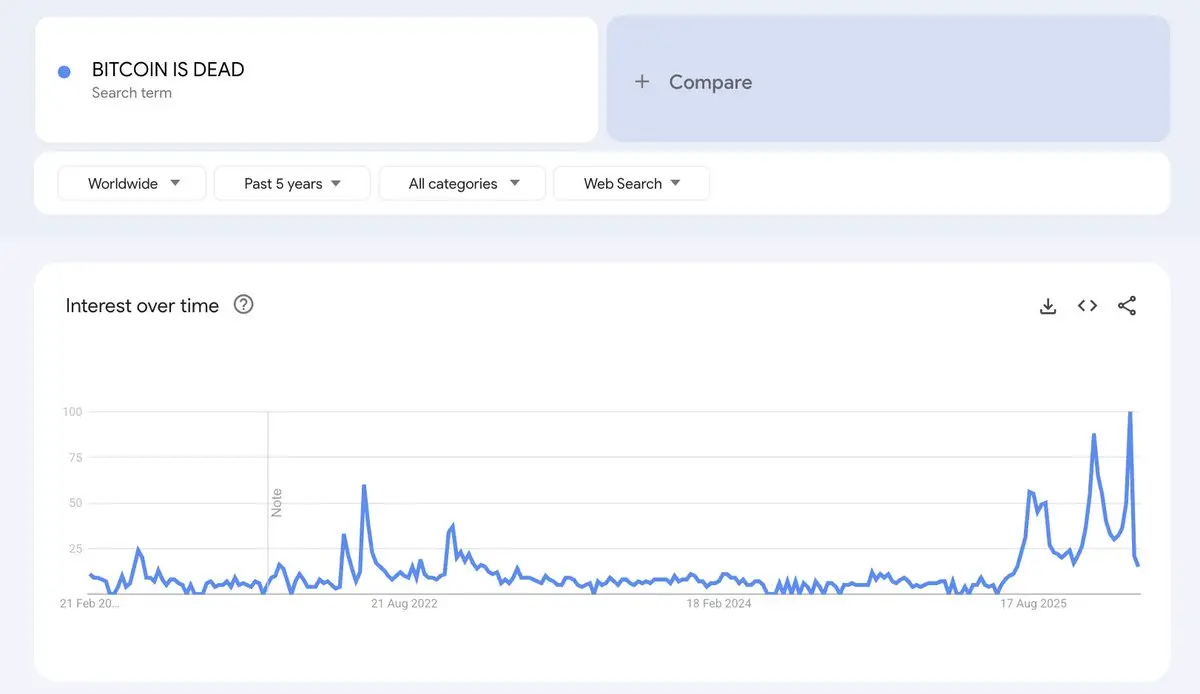
🚨 FEAR AT ATH: Google searches for Bitcoin is dead have set a new record such panic in the market was last seen only during the FTX crash!
BTC0.03%
- Reward
- 1
- Comment
- Repost
- Share
#GrayscaleEyesAVESpotETFConversion The potential conversion of the AVE fund into a spot ETF by Grayscale Investments signals a deeper institutional integration of cryptocurrency markets into regulated financial infrastructure. The move reflects the growing tendency of traditional asset managers to transform trust-based crypto exposure products into exchange-listed investment instruments that offer higher liquidity, better price discovery, and improved transparency for investors.
The discussion is closely linked to exposure to the decentralized lending ecosystem of Aave, which has become one o
The discussion is closely linked to exposure to the decentralized lending ecosystem of Aave, which has become one o

- Reward
- 8
- 11
- Repost
- Share
AylaShinex :
:
2026 GOGOGO 👊View More
1000
DIO
Created By@Badarmo00
Listing Progress
0.00%
MC:
$0.1
More Tokens
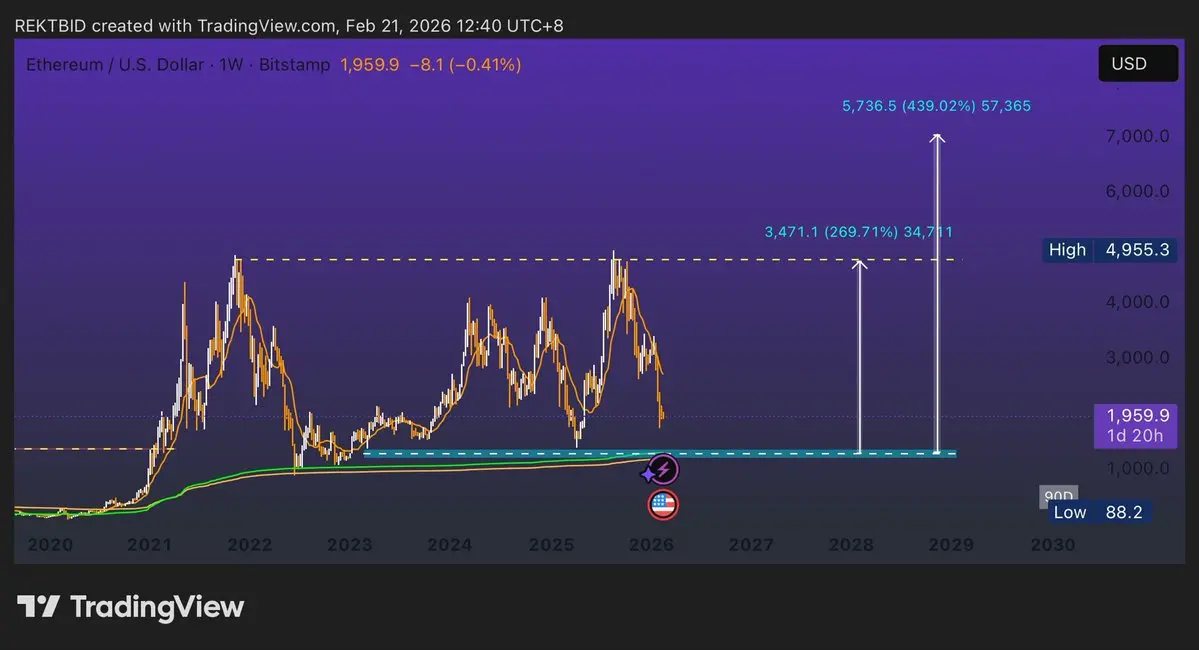
As of early 2026, it remains the largest cryptocurrency, often influencing the broader market

- Reward
- 1
- Comment
- Repost
- Share
Ethereum plans major upgrades over the next five years
1
- Reward
- like
- Comment
- Repost
- Share
- Reward
- 1
- Comment
- Repost
- Share
🚀 Grayscale Eyes AVE Spot ETF Conversion
Grayscale is taking a bold step towards expanding access to cryptocurrency investment by exploring the conversion of its AVE product into a Spot ETF. This move could provide investors with a more transparent, regulated, and convenient way to gain exposure to AVE, bridging traditional finance with the growing crypto market.
The potential Spot ETF conversion reflects the evolving landscape of digital assets and signals growing institutional interest. As regulatory clarity improves, such conversions could pave the way for broader adoption and deeper marke

- Reward
- 2
- Comment
- Repost
- Share
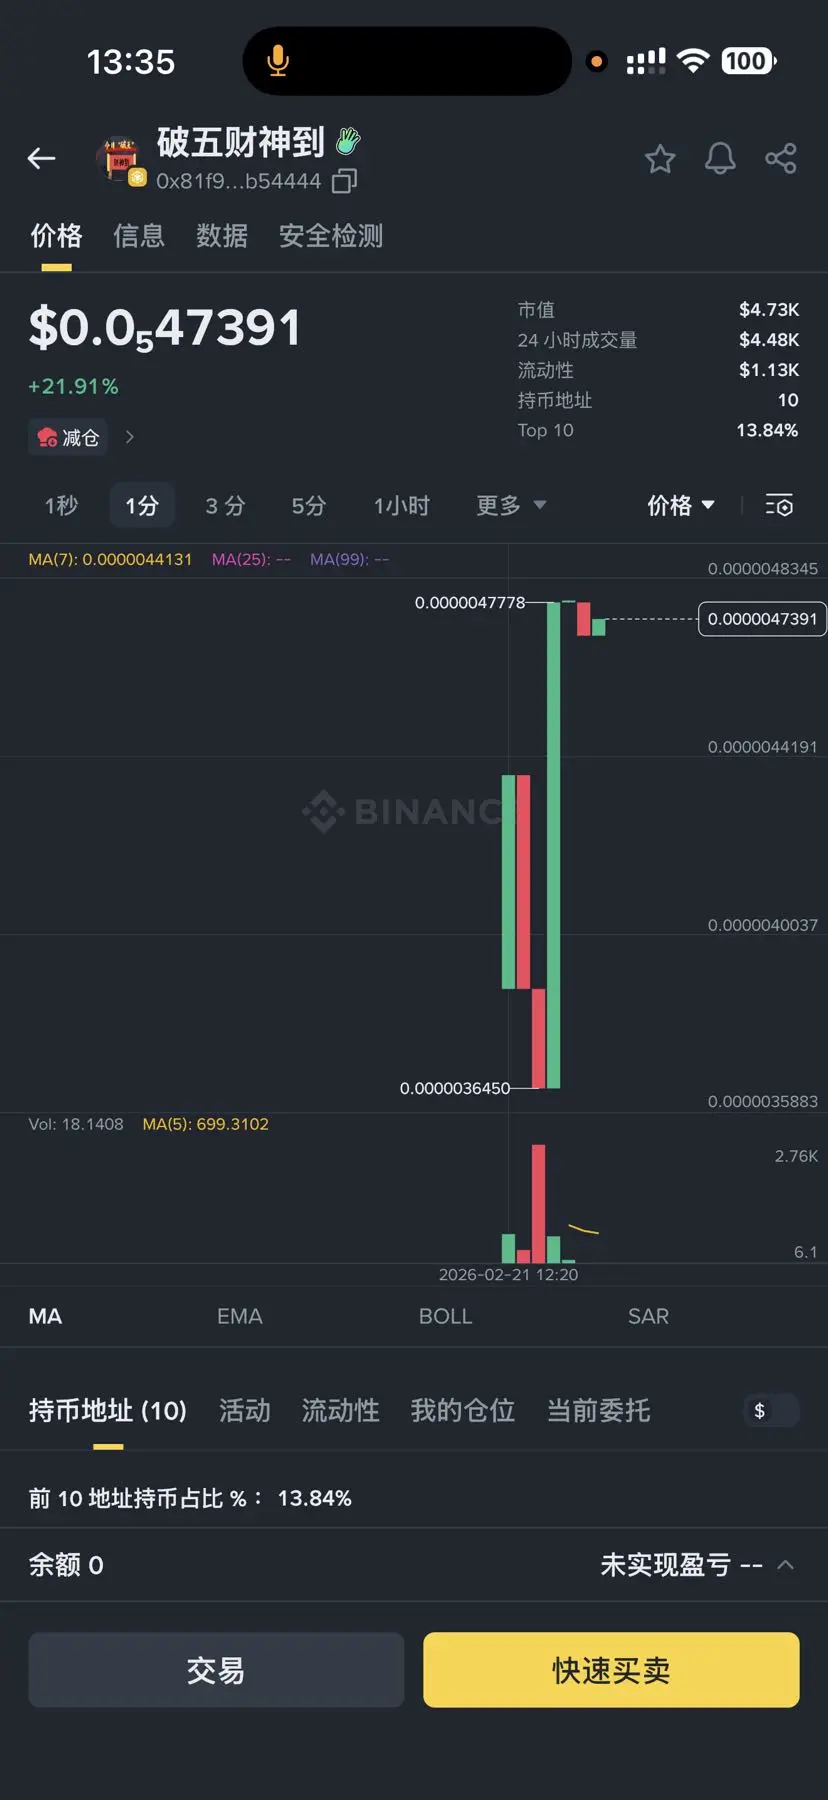
CCTV News announces the arrival of the God of Wealth on the fifth day of the lunar month, breaking the fifth today! Let's welcome the God of Wealth together!
View Original
- Reward
- 1
- Comment
- Repost
- Share
Currently, short positions around 68,000 on Bitcoin are about 1,500 points in profit, and short positions in the 67,500-68,000 range have over 1,000 points in profit. Remaining positions continue to watch 65,500. Everyone can set their own profit protection and reduce positions accordingly. There will be real-time order updates later, so follow to not miss out.…………#何时是最佳入场时机
View Original
- Reward
- 1
- Comment
- Repost
- Share
[New Streamer]🔹 Bitcoin briefly spiked to $68,000 — is it still wise to go long?
0
- Reward
- like
- Comment
- Repost
- Share
#Celebrating the New Year at Gate Square
In 2026, the Year of the Horse, my wealth-boosting horse coin is: never stopping to rise, stable and not collapsing, all holdings in the green!
May you lead the way, your fortune soar, and your wallet quickly fill up!🐎🧧
View OriginalIn 2026, the Year of the Horse, my wealth-boosting horse coin is: never stopping to rise, stable and not collapsing, all holdings in the green!
May you lead the way, your fortune soar, and your wallet quickly fill up!🐎🧧

- Reward
- like
- Comment
- Repost
- Share
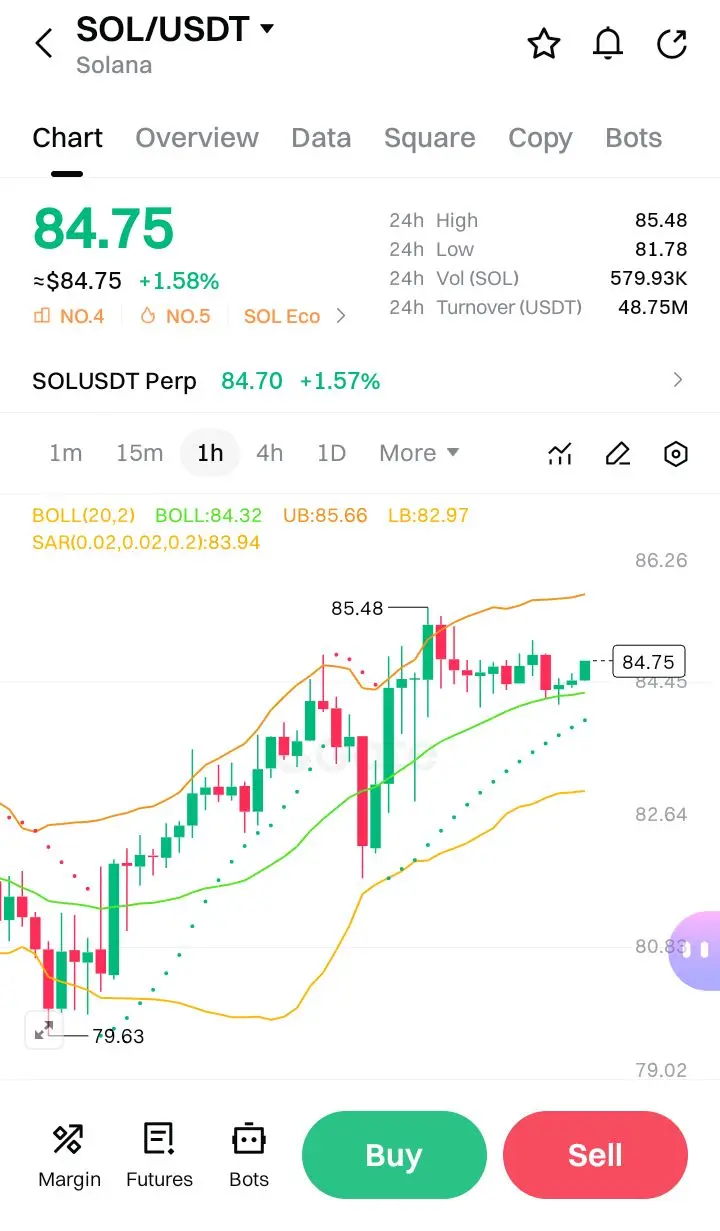
$SOL #SOLStandsStrong
SOL/USDT chart data, Here is a technical analysis covering candlestick patterns, market structure, support and resistance, and chart patterns.
Market Structure
· Framing: On the 1-hour (1h) timeframe, the market is trading above the SAR (Sar Parabolic) indicator at 83.94, which is a bullish signal.
· Trend Context: The price is currently sitting just below the recent 24h High of 85.48. The fact that the price is holding above the middle line of the Bollinger Bands (84.32) suggests that momentum is favoring the bulls in the short term.
Support and Resistance
· Immediate R
SOL1.57%

- Reward
- 1
- Comment
- Repost
- Share
财神
财神爷
Created By@GoldenCommander
Listing Progress
0.00%
MC:
$2.47K
More Tokens
Check out Gate and join me in the hottest event! https://www.gate.com/campaigns/4042?ref_type=132&utm_cmp=uTZ8QzFk
- Reward
- 1
- Comment
- Repost
- Share
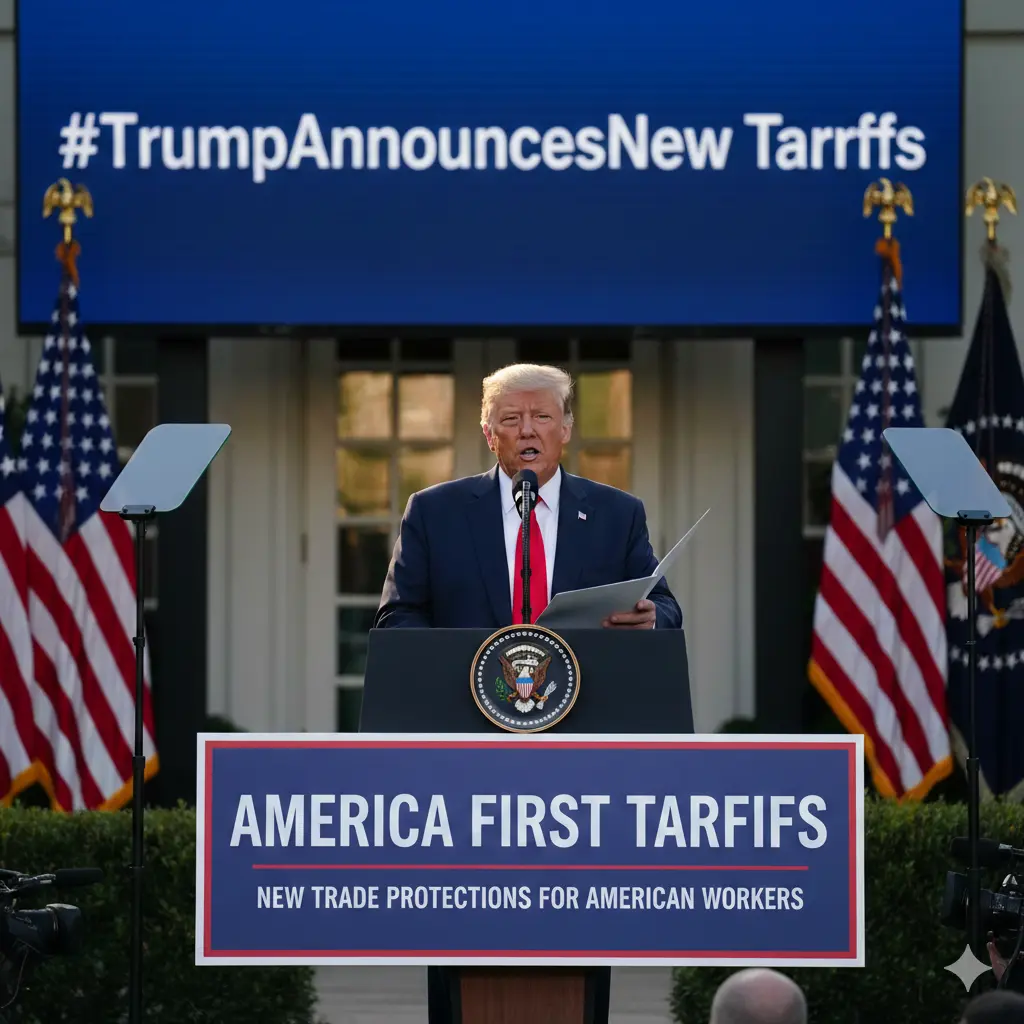
#TrumpAnnouncesNewTariffs
Supreme Court Shakeup and a New Trade Strategy
In a dramatic development on February 20-21, 2026, the #TrumpAnnouncesNewTariffs trended globally as the United States faced a major constitutional and economic clash between the executive branch and the judiciary. The U.S. Supreme Court, the country’s highest legal authority, ruled by a 6-3 majority that former President Donald Trump had exceeded his power by imposing broad, sweeping tariffs under an emergency economic law (the International Emergency Economic Powers Act IEEPA), effectively striking down his signature g


- Reward
- 2
- 2
- Repost
- Share
Vortex_King:
To The Moon 🌕View More
Participate in horse racing betting, complete tasks to earn horse racing tickets, and enjoy a million red envelope rain daily, sharing a prize pool of 100,000 USDT at the Gate 2026 Spring Festival Celebration. https://www.gate.com/competition/year-of-horse-2026?ref_type=165&utm_cmp=7EQB9Jba&ref=VLRGUVFFUW
View Original
- Reward
- 1
- Comment
- Repost
- Share
Participate in horse racing betting, complete tasks to earn horse racing tickets, and enjoy a million red envelope rain daily, sharing a prize pool of 100,000 USDT at the Gate 2026 Spring Festival Celebration. https://www.gate.com/competition/year-of-horse-2026?ref_type=165&utm_cmp=7EQB9Jba&ref=BgJBAV0
View Original
- Reward
- 1
- Comment
- Repost
- Share
Participate in horse racing betting, complete tasks to earn horse racing tickets, and enjoy a million red envelope rain daily, sharing a prize pool of 100,000 USDT at the Gate 2026 Spring Festival Celebration. https://www.gate.com/competition/year-of-horse-2026?ref_type=165&utm_cmp=7EQB9Jba&ref=VLDBAVSKBG
View Original
- Reward
- 1
- Comment
- Repost
- Share
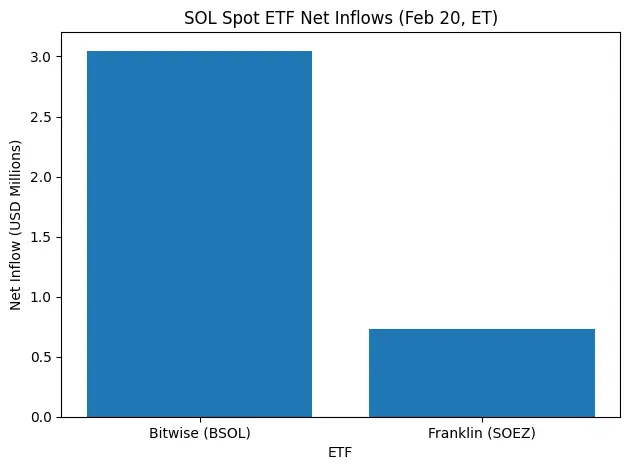
📈 U.S. SOL Spot ETF Inflows Signal Growing Institutional Interest
U.S. SOL spot ETFs recorded a total net inflow of $3.77 million in a single day (February 20, Eastern Time), according to data from SoSoValue. While the number may seem modest compared to Bitcoin or Ethereum ETFs, it reflects consistent and sustained capital allocation toward Solana within regulated investment products.
The standout performer of the day was the Bitwise Solana Staking ETF (BSOL), which attracted $3.05 million in net inflows. This pushed its total cumulative inflow to an impressive $694 million, reinforcing Bitwi
- Reward
- 1
- Comment
- Repost
- Share
Participate in horse racing betting, complete tasks to earn horse racing tickets, and enjoy a million red envelope rain daily, sharing a prize pool of 100,000 USDT at the Gate 2026 Spring Festival Celebration. https://www.gate.com/competition/year-of-horse-2026?ref_type=165&utm_cmp=7EQB9Jba&ref=VVKWU1KMAW
View Original
- Reward
- 1
- Comment
- Repost
- Share
$SUI Few Web3 teams can build hardware.
Even fewer can build it right — from scratch, not off-the-shelf.
Suiball is doing it. A real asset to the Sui ecosystem.
Real value unlocks once the first devices ship.
#Web3 #Hardware #Sui #Crypto #Blockchain
Even fewer can build it right — from scratch, not off-the-shelf.
Suiball is doing it. A real asset to the Sui ecosystem.
Real value unlocks once the first devices ship.
#Web3 #Hardware #Sui #Crypto #Blockchain
SUI1.23%
[The user has shared his/her trading data. Go to the App to view more.]
- Reward
- 2
- Comment
- Repost
- Share
Load More
Join 40M users in our growing community
⚡️ Join 40M users in the crypto craze discussion
💬 Engage with your favorite top creators
👍 See what interests you
Trending Topics
View More283.42K Popularity
88.7K Popularity
410.99K Popularity
107.75K Popularity
14.96K Popularity
News
View MoreNBA retired star Pippen posts to reaffirm his faith in Bitcoin
10 m
Sonic Labs CEO and Business Leader Depart
48 m
Data: Retail investors continue to increase their Bitcoin holdings, but whale sell-offs may suppress rebound potential
1 h
A wallet associated with Pump.fun has sold a total of 3.376 billion PUMP tokens so far.
1 h
Data: Ethereum spot ETF had a total net inflow of $17,200 yesterday, with BlackRock's ETHA leading with a net inflow of $1,782,600.
1 h
Pin