Trade
Basic
Futures
Futures
Hundreds of contracts settled in USDT or BTC
TradFi
Gold
Trade global traditional assets with USDT in one place
Options
Hot
Trade European-style vanilla options
Unified Account
Maximize your capital efficiency
Demo Trading
Futures Kickoff
Get prepared for your futures trading
Futures Events
Participate in events to win generous rewards
Demo Trading
Use virtual funds to experience risk-free trading
Earn
Launch
CandyDrop
Collect candies to earn airdrops
Launchpool
Quick staking, earn potential new tokens
HODLer Airdrop
Hold GT and get massive airdrops for free
Launchpad
Be early to the next big token project
Alpha Points
Trade on-chain assets and enjoy airdrop rewards!
Futures Points
Earn futures points and claim airdrop rewards
Investment
Simple Earn
Earn interests with idle tokens
Auto-Invest
Auto-invest on a regular basis
Dual Investment
Buy low and sell high to take profits from price fluctuations
Soft Staking
Earn rewards with flexible staking
Crypto Loan
0 Fees
Pledge one crypto to borrow another
Lending Center
One-stop lending hub
VIP Wealth Hub
Customized wealth management empowers your assets growth
Private Wealth Management
Customized asset management to grow your digital assets
Quant Fund
Top asset management team helps you profit without hassle
Staking
Stake cryptos to earn in PoS products
Smart Leverage
New
No forced liquidation before maturity, worry-free leveraged gains
GUSD Minting
Use USDT/USDC to mint GUSD for treasury-level yields
More
十一
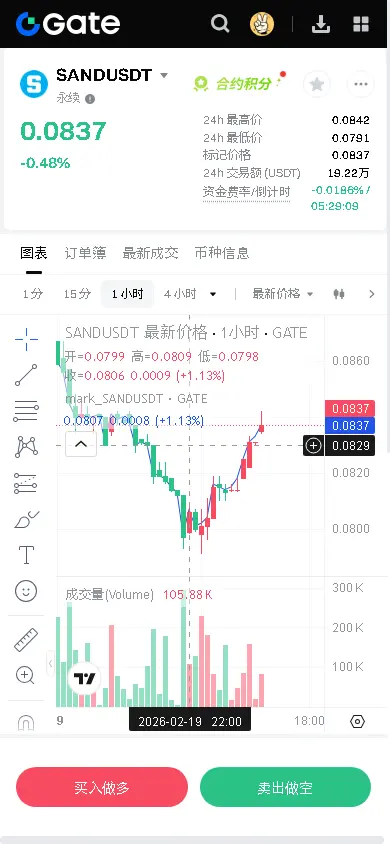
【$SAND Signal】1H breakout pullback confirmation, short-term short squeeze rebound
$SAND The 1H timeframe, after experiencing consecutive declines, formed a small double bottom around 0.0815 and broke through the short-term downtrend line and EMA20(0.0824) with increased volume. The current price is retesting the breakout level, with 1H RSI(62.6) remaining strong, and buy order depth (bid_ask_ratio_depth=1.79) significantly better than sell orders, indicating strong support below. Although the 4H timeframe is still in a bearish trend, the latest candle closed with a long lower shadow bullish ca
View Original$SAND The 1H timeframe, after experiencing consecutive declines, formed a small double bottom around 0.0815 and broke through the short-term downtrend line and EMA20(0.0824) with increased volume. The current price is retesting the breakout level, with 1H RSI(62.6) remaining strong, and buy order depth (bid_ask_ratio_depth=1.79) significantly better than sell orders, indicating strong support below. Although the 4H timeframe is still in a bearish trend, the latest candle closed with a long lower shadow bullish ca
- Reward
- 2
- Comment
- Repost
- Share
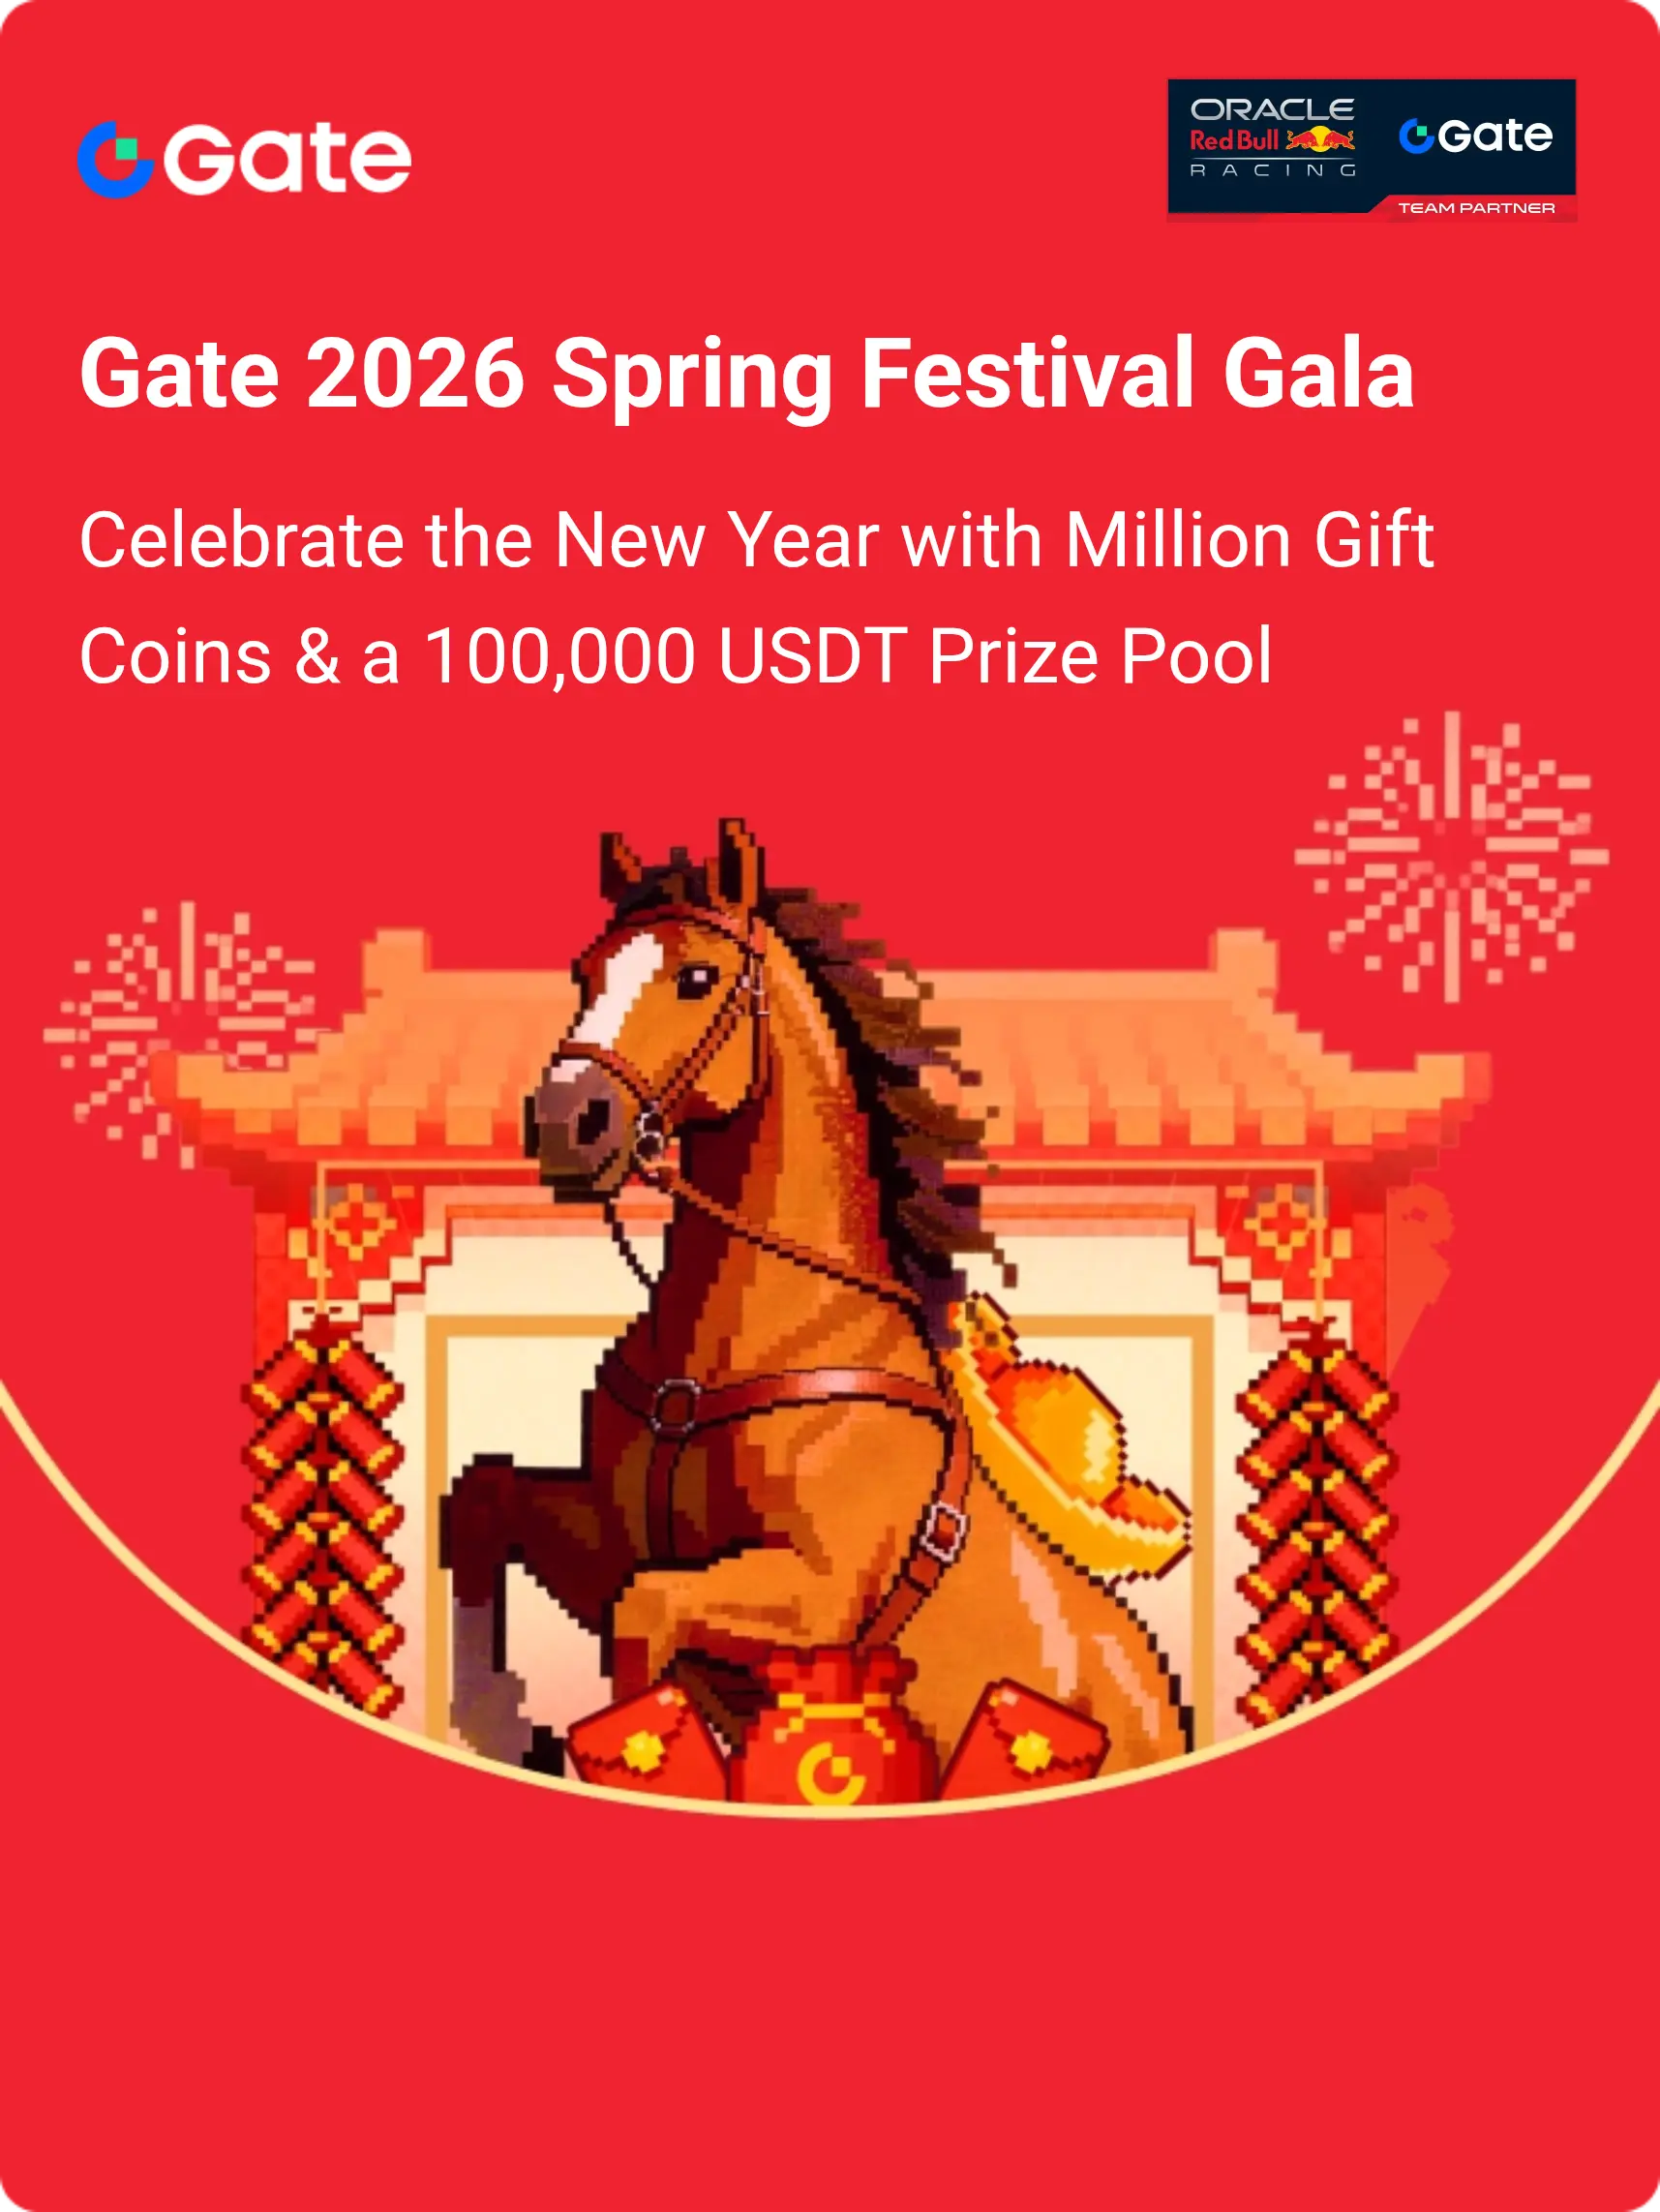
Join the horse racing predictions, complete tasks to earn horse racing tickets, enjoy daily million Gift Coins giveaways, and share a 100,000 USDT prize pool—all at the Gate 2026 Spring Festival Celebration. https://www.gate.com/competition/year-of-horse-2026?ref_type=165&utm_cmp=7EQB9Jba&ref=A1RMVl8N
- Reward
- 2
- Comment
- Repost
- Share
MML
马来了
Created By@GateUser-1f7e0886
Listing Progress
0.00%
MC:
$0.1
More Tokens
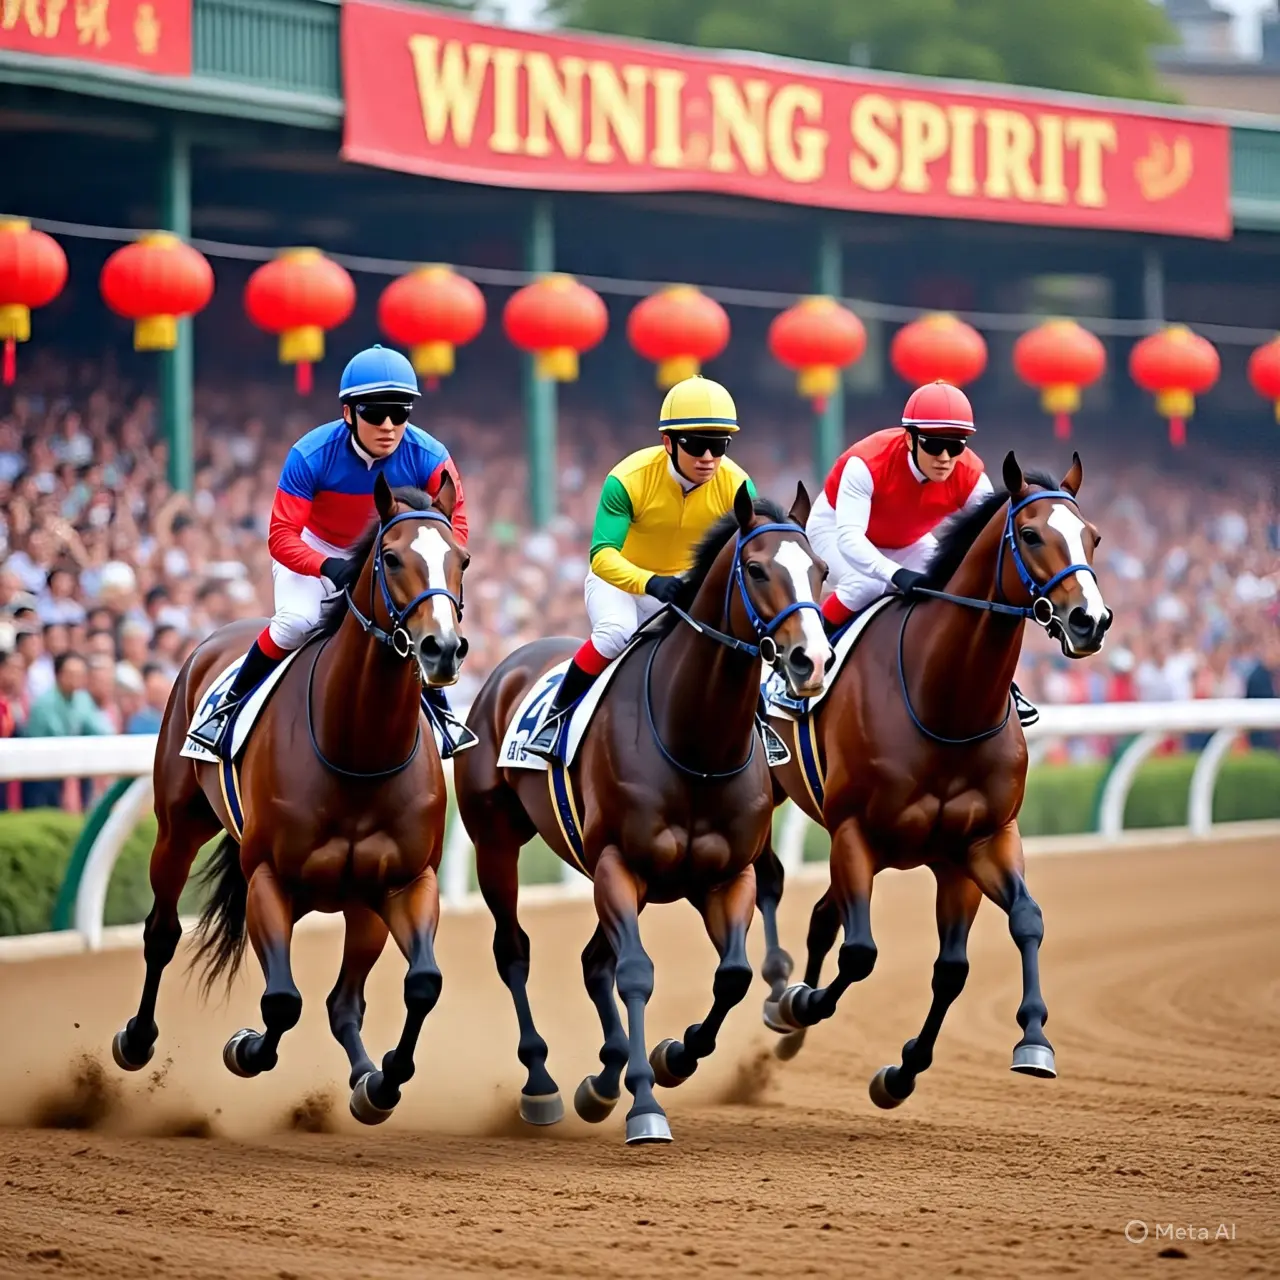
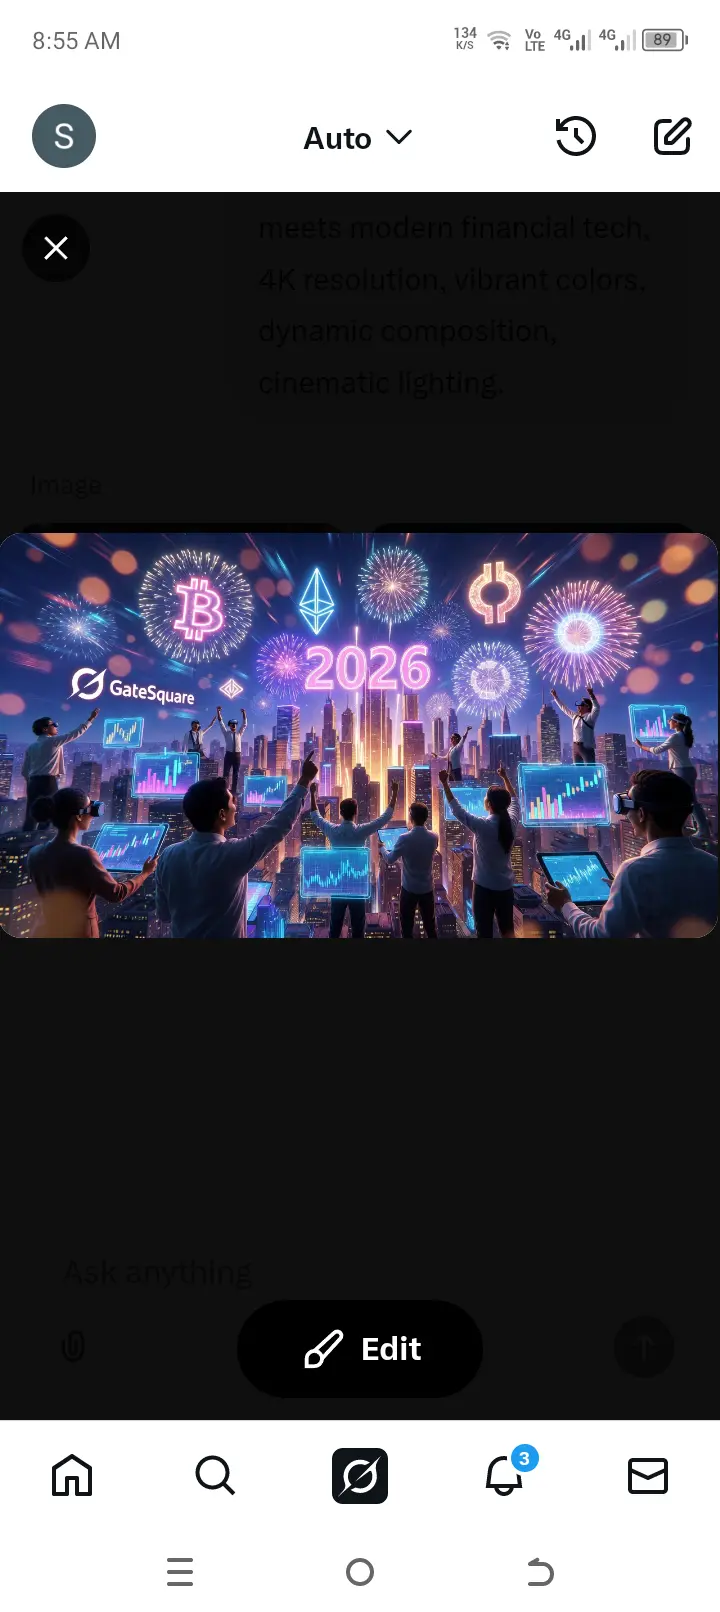
#GateSpringFestivalHorseRacingEvent 🐎🌸
Speed, spirit, and celebration all in one place!
Where tradition meets thrill and every heartbeat matches the race.
What a spectacular festival atmosphere!
Elegant & classy
#GateSpringFestivalHorseRacingEvent
A perfect blend of grace, power, and celebration.
Hooves on track, cheers in the air, and memories in the making.
Energetic crowd vibe
#GateSpringFestivalHorseRacingEvent
The crowd is roaring, the horses are flying, and the festival spirit is unstoppable!
Pure adrenaline. Pure celebration.
Short & catchy
#GateSpringFestivalHorseRacingEvent
Fast rac


- Reward
- 3
- 1
- Repost
- Share
Peacefulheart :
:
To The Moon 🌕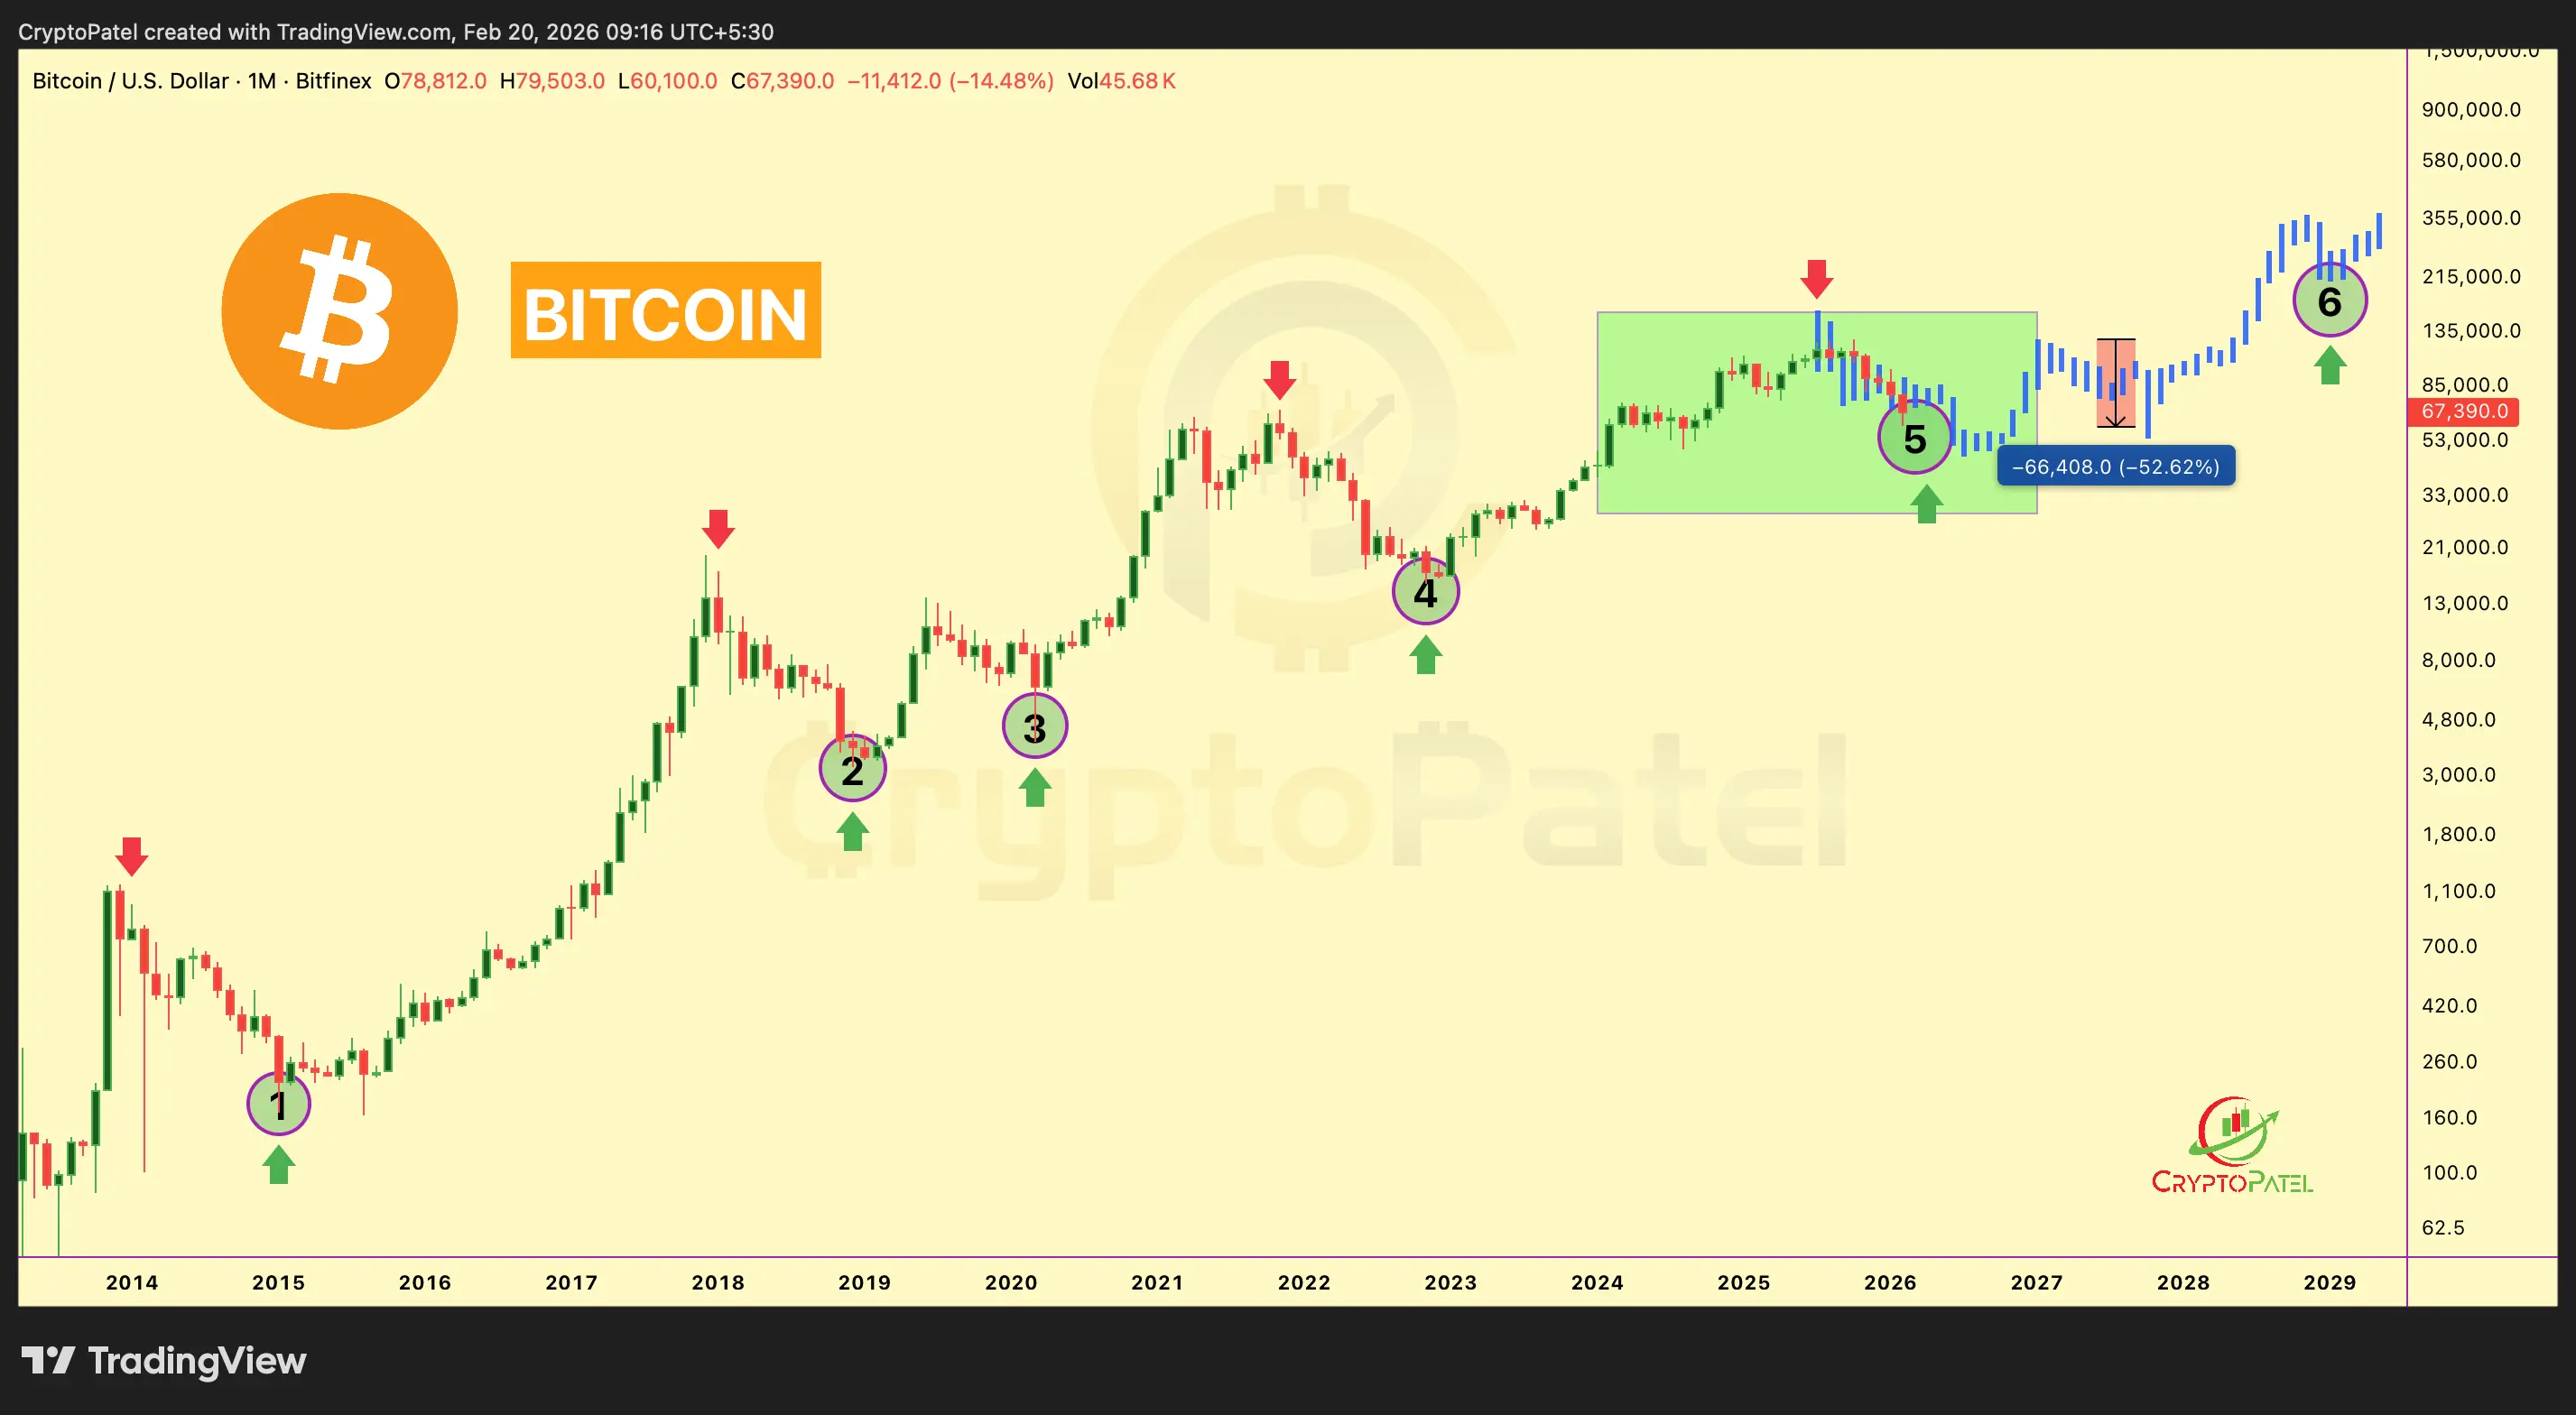
- Reward
- 2
- Comment
- Repost
- Share
Participate in horse racing betting, complete tasks to earn horse racing tickets, and enjoy a million red envelope rain daily, sharing a prize pool of 100,000 USDT at the Gate 2026 Spring Festival Celebration. https://www.gate.com/competition/year-of-horse-2026?ref_type=165&utm_cmp=7EQB9Jba&ref=AlERV18M
View Original
- Reward
- 2
- Comment
- Repost
- Share
Presence distilled to its essence cuts sharper than any broadcast.
Visualize the final sifting basket: everything extraneous shaken away until only core remains—clear, potent, unmistakable. Gate Square’s closing act distills precisely this—red envelope favor flows to voices still generating meaningful echo; last-chance draws reward refined authenticity; top honors seek creators who evolved from participation to meaningful imprint.
Distilled presence is the reward for those who refused to dilute themselves. Gate Square quietly proves itself one of the smarter arenas: it allows signal to concent
- Reward
- 5
- 4
- Repost
- Share
MrFlower_XingChen:
To The Moon 🌕View More
#GateLunarNewYearOn-ChainGala
1. Event Concept & Theme
Gate.io’s Lunar New Year On-Chain Gala is not just a festival—it’s a digital-meets-physical experience.
Combines traditional Lunar New Year celebrations with blockchain-based interactivity.
Themes: Year of the Horse / Lunar New Year motifs with modern crypto aesthetics.
Goal: Engage the community globally while giving real on-chain rewards.
2. Blockchain Integration
On-chain rewards & NFTs: Users complete tasks, trades, or games to earn tokens and NFTs instantly recorded on-chain.
Transparency & verification: Every prize, transaction, and


- Reward
- 8
- 10
- Repost
- Share
User_any:
2026 GOGOGO 👊View More
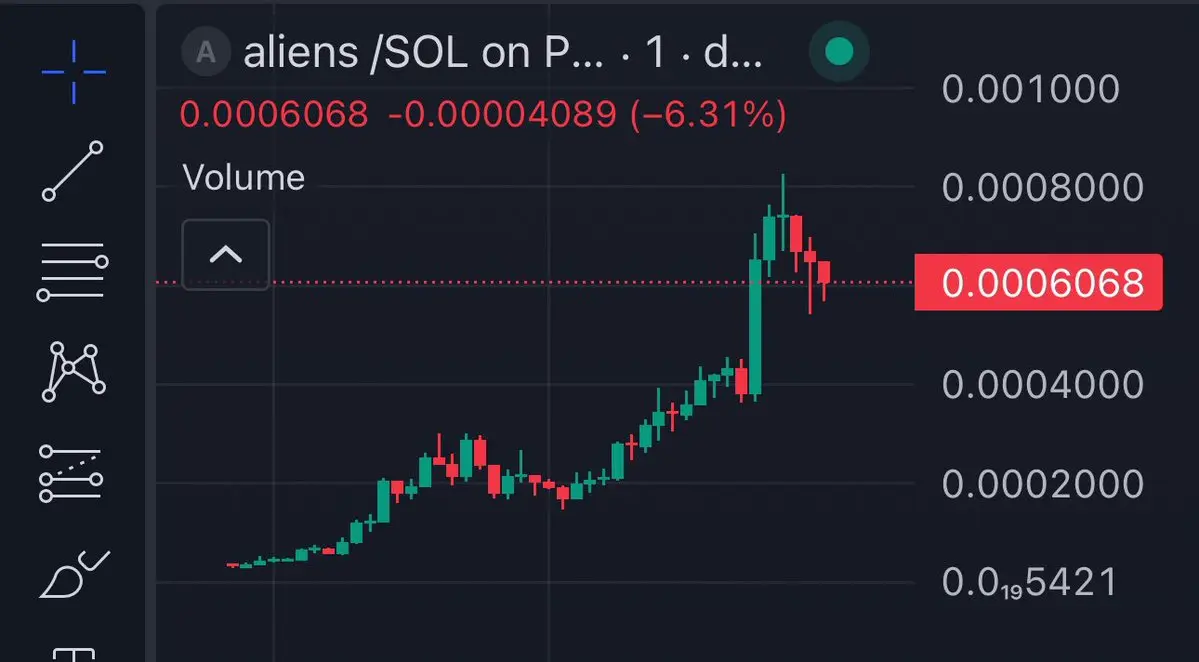
8X on $ALIENS now from the call sheeeshhh
This owns flying 93K to 750K for the ones who caught the entry!!
More bangers rolling out today be ready!! volume is going insane🥁
This owns flying 93K to 750K for the ones who caught the entry!!
More bangers rolling out today be ready!! volume is going insane🥁
- Reward
- 2
- Comment
- Repost
- Share
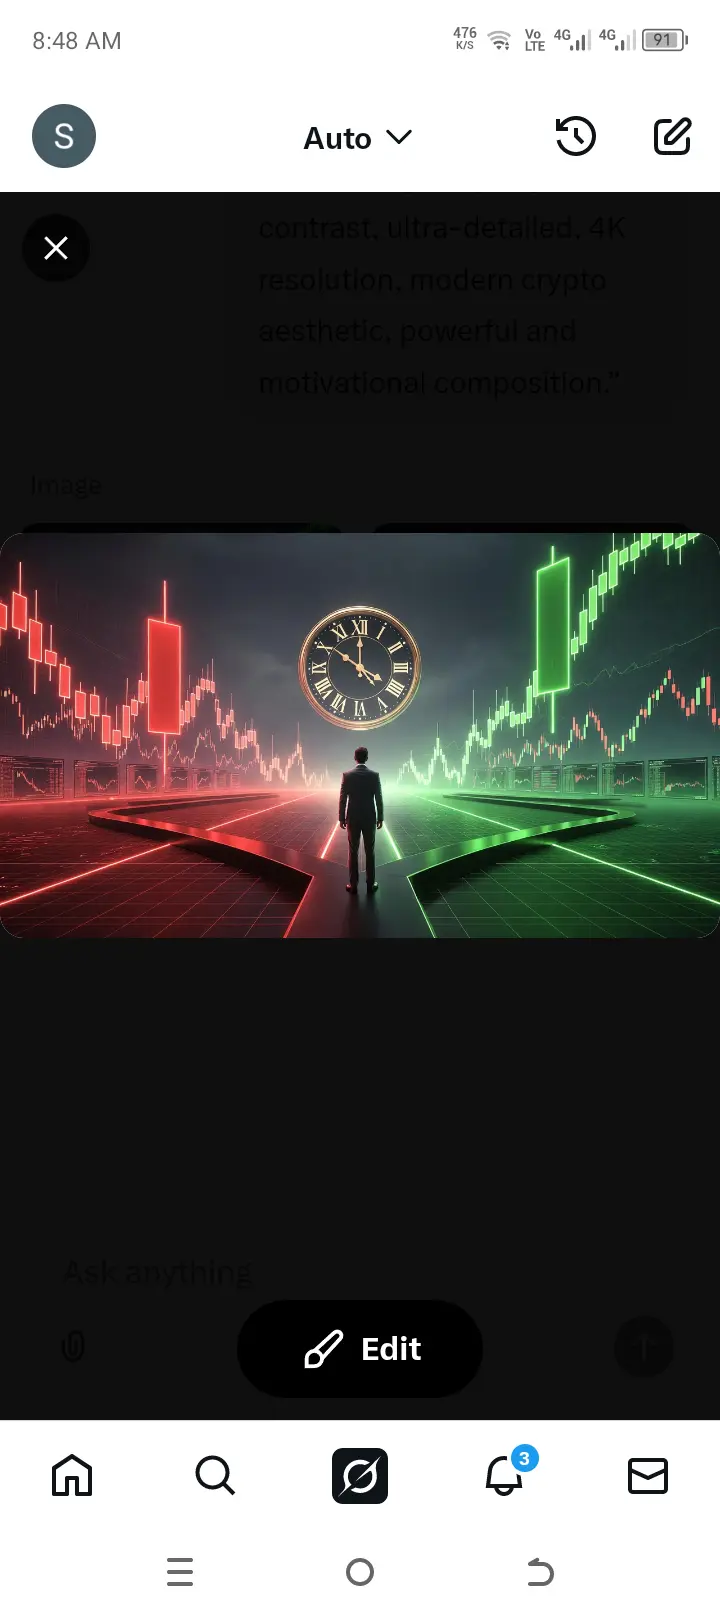
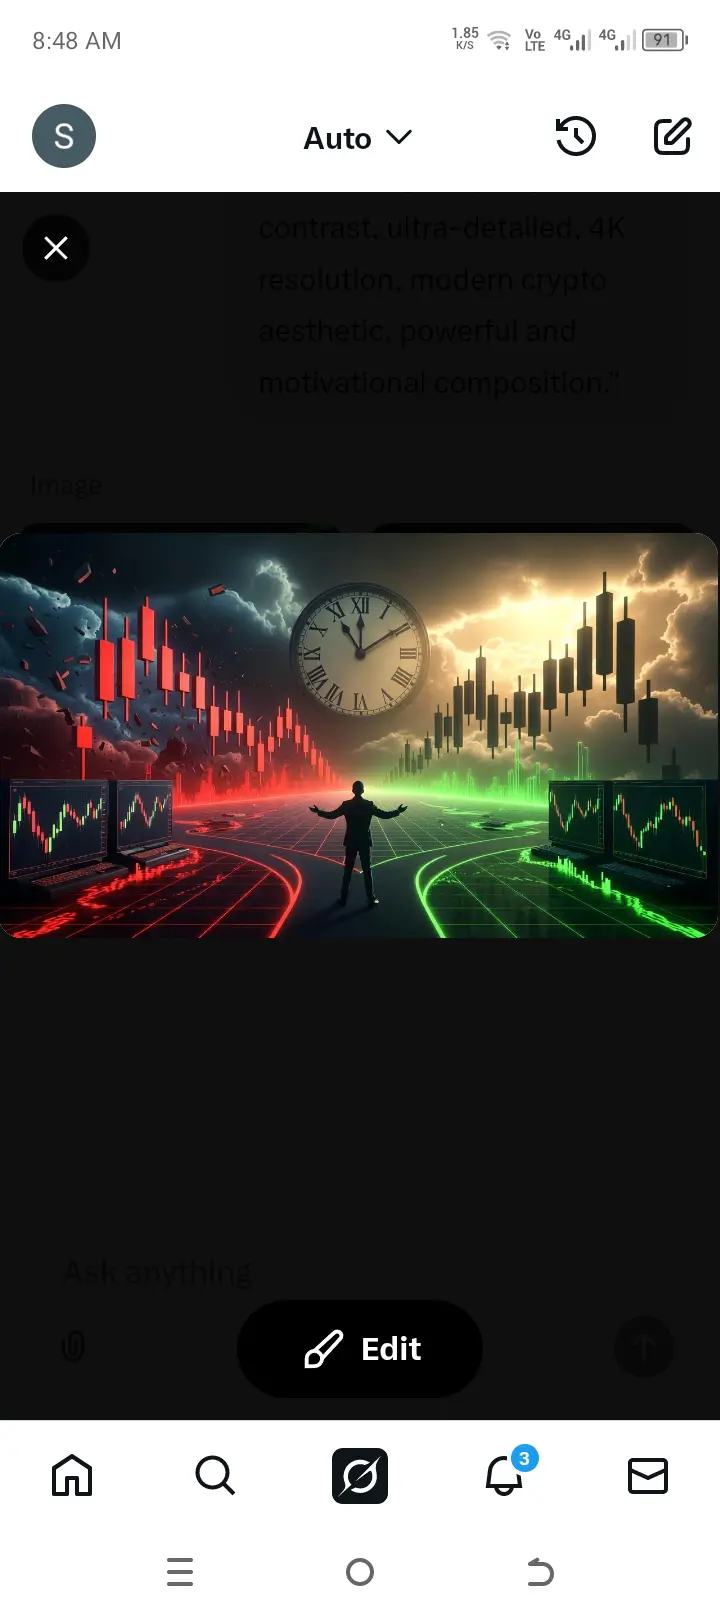
#WhenisBestTimetoEntertheMarket 📊🚀 When Is the Best Time to Enter the Market?
Timing the market perfectly is almost impossible — but positioning yourself wisely is powerful. 💡
Here’s how smart investors approach entries 👇
🔹 Buy Fear, Not Hype
When sentiment is negative and everyone is panicking, prices often offer better risk-to-reward setups.
🔹 After Healthy Corrections
Strong assets pull back before continuing trends. Corrections ≠ collapse.
🔹 Dollar-Cost Averaging (DCA)
Instead of waiting for the “perfect” bottom, invest consistently over time.
🔹 Follow the Trend
Don’t fight strong
- Reward
- 3
- 1
- Repost
- Share
Yunna:
Diamond Hands 💎$GT #WhenisBestTimetoEntertheMarket
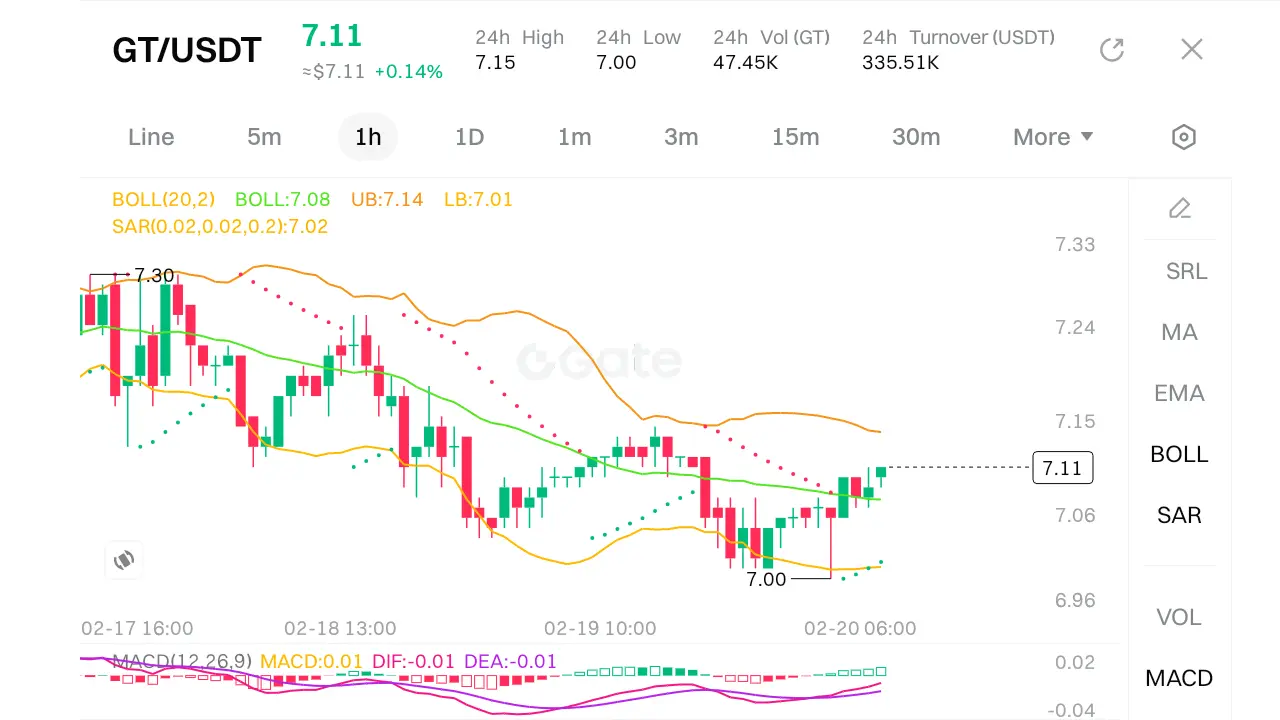
Market Structure Analysis (GT/USDT)
Higher Timeframe (4H chart):
· Price recently made a low at 7.00 (24h low) and is currently trading at 7.11.
· The SAR (7.02) is below price, indicating a bullish trend.
· Bollinger Bands (20,2) show middle band at 7.08, upper at 7.14, lower at 7.01. Price is near the upper band, suggesting resistance.
· Key resistance levels: 7.15 (24h high) and 7.33 (previous swing high).
· Key support (demand zone): 7.00–7.02 (lower band and SAR confluence).
Lower Timeframe (15min chart from second screenshot):
· Price is consolidating
GT-0.28%
- Reward
- 3
- Comment
- Repost
- Share
p小将
p小将
Created By@DreamJourney
Listing Progress
100.00%
MC:
$1.76K
More Tokens
#我在Gate广场过新年 Crypto Daily(02.19):Bitcoin Enters Late-Stage Bear Market Consolidation, Institutional Holdings Diverge, Regulatory Framework Emerges
1. Cryptocurrency Market Trends and Price Analysis
1. Research firm K33 notes that the current Bitcoin market structure, derivatives positions, and ETF capital flows are highly similar to the late-stage bear market of 2022, indicating a possible long-term consolidation range ($60,000 to $75,000), rather than a quick rebound. Historical data shows an average 90-day return of about 3% after market bottoms.
2. Analyst Arthur Hayes believes Bitcoin is a
BTC0.45%


- Reward
- 10
- 7
- Repost
- Share
MrFlower_XingChen:
To The Moon 🌕View More
Check out Gate and join me in the hottest event! https://www.gate.com/campaigns/3998?ch=824&ref=VLRAVV5XAG&ref_type=132&utm_cmp=SEz74YgP
- Reward
- 4
- 2
- Repost
- Share
MrFlower_XingChen:
To The Moon 🌕View More
#GrayscaleEyesAVESpotETFConversion
Grayscale Eyes AAVE Spot ETF Conversion DeFi Moves Closer to Wall Street Integration
When a digital asset manager begins exploring the conversion of a trust product into a spot ETF, it is never just a technical filing. It is a structural statement. The development that Grayscale is eyeing a potential spot ETF conversion tied to AAVE signals something larger than product expansion it signals that decentralized finance is moving deeper into regulated capital markets.
At the center of this discussion is Grayscale Investments, one of the most influential digit
AAVE-0.16%

- Reward
- 7
- 5
- Repost
- Share
Yunna:
Diamond Hands 💎View More
#GateHKEventsKickOff 🚀
Hong Kong has long stood at the crossroads of global finance and innovation, making it the perfect stage for the next wave of digital asset conversations. With GateHKEventsKickOff, the spotlight turns toward a series of gatherings designed to connect traders, builders, investors, and curious minds who share a passion for the evolving crypto ecosystem.
This kickoff isn’t just another event announcement — it represents momentum. It signals fresh opportunities for networking, knowledge-sharing, and exploring what’s next for blockchain technology in one of the world’s most
DEFI-3.5%

- Reward
- 6
- 4
- Repost
- Share
Vortex_King:
LFG 🔥View More
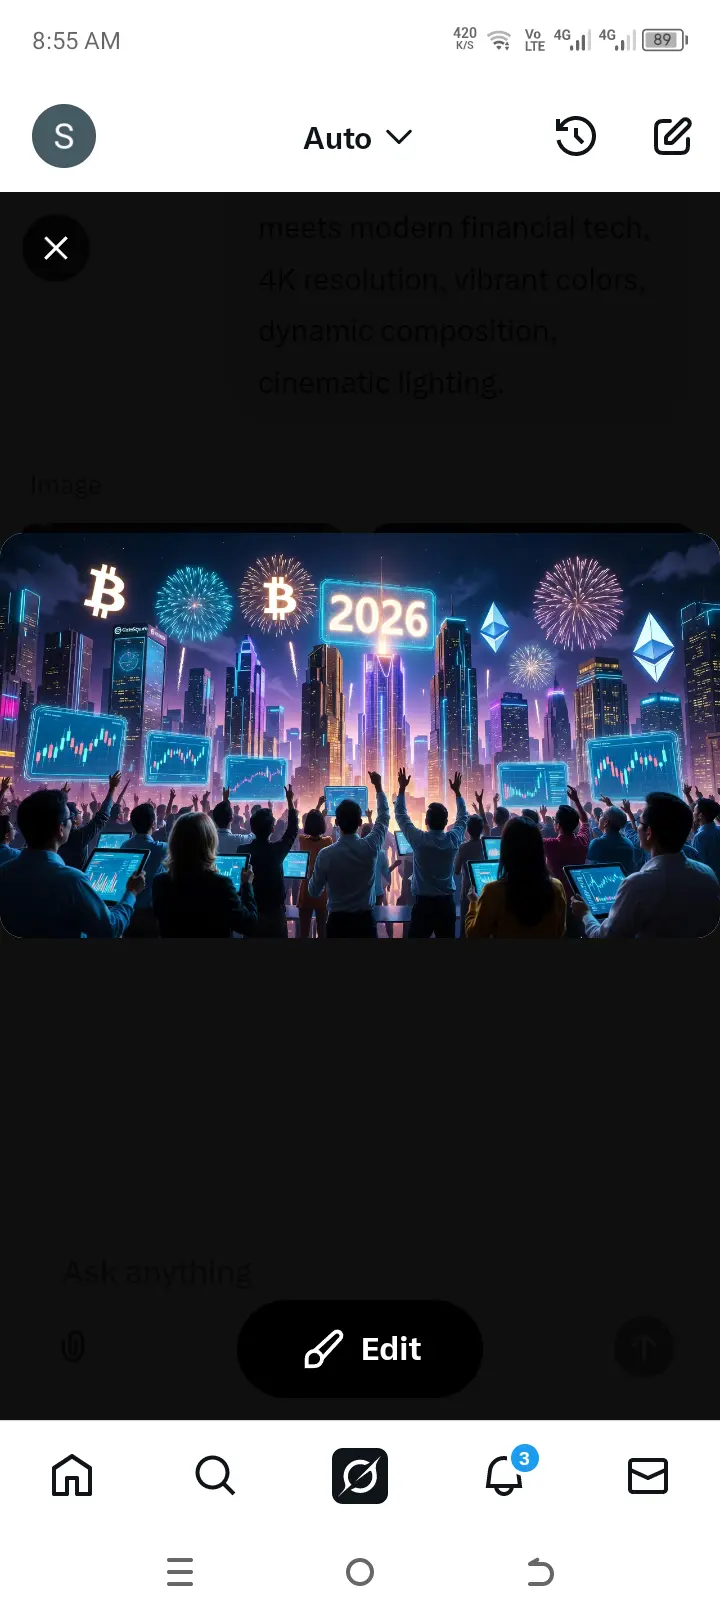
#CelebratingNewYearOnGateSquare #CelebratingNewYearOnGateSquare 🎆✨
The New Year isn’t just a change of calendar — it’s a reset in mindset, momentum, and market psychology.
As we step into 2026, the energy on GateSquare feels stronger than ever. A growing community, sharper strategies, and bigger ambitions. 🚀
In trading — just like in life — every new cycle brings three powerful things:
🔹 Reflection – What worked? What didn’t?
🔹 Recalibration – Adjusting strategy, managing risk smarter.
🔹 Renewed Conviction – Entering the market with clarity and confidence.
🌟 2026 Goals on GateSquare:
• S
- Reward
- 4
- 2
- Repost
- Share
neesa04:
2026 GOGOGO 👊View More
#CelebratingNewYearOnGateSquare
The GateSquare New Year Celebration is far more than a symbolic countdown; it has evolved into one of the most significant community-driven events in the crypto ecosystem, combining celebration, engagement, and strategic participation. Unlike traditional market-focused campaigns, this event focuses on creating shared experiences where users feel actively involved rather than passive spectators. Across the platform, thousands of participants join in claiming rewards, engaging in competitions, and exploring gamified experiences designed to enhance both entertainm
The GateSquare New Year Celebration is far more than a symbolic countdown; it has evolved into one of the most significant community-driven events in the crypto ecosystem, combining celebration, engagement, and strategic participation. Unlike traditional market-focused campaigns, this event focuses on creating shared experiences where users feel actively involved rather than passive spectators. Across the platform, thousands of participants join in claiming rewards, engaging in competitions, and exploring gamified experiences designed to enhance both entertainm

- Reward
- 2
- 1
- Repost
- Share
Yunna:
Diamond Hands 💎🔹 An analyst under Tom Lee: ETH may have bottomed at $1,367, with an implied 12-month upside potential of 81percetage
532
- Reward
- like
- Comment
- Repost
- Share
Load More
Join 40M users in our growing community
⚡️ Join 40M users in the crypto craze discussion
💬 Engage with your favorite top creators
👍 See what interests you
Trending Topics
View More245.78K Popularity
871.07K Popularity
10.63M Popularity
98.65K Popularity
517.57K Popularity
Hot Gate Fun
View More- MC:$2.44KHolders:10.00%
- MC:$2.44KHolders:10.00%
- MC:$2.44KHolders:10.00%
- MC:$2.43KHolders:00.00%
- MC:$0.1Holders:10.00%
News
View MoreMessari Report: Decibel is building a powerful and highly transparent decentralized exchange platform (DEX)
12 m
Base Co-creation: The theme for 2026 is Customer First, Building What Customers Need
13 m
Yesterday, the US Bitcoin spot ETF experienced a net outflow of $165.69 million.
25 m
Yesterday, US Ethereum spot ETF experienced a net outflow of $130.51 million.
26 m
AI Agent Discovery Page AgentScan is now live on the Base chain
29 m
Pin