BankOfChinaReview
☞ Live broadcast every night from 9 to 10!
No highs or lows in my heart, no prices in my heart, trading follows my heart.
short-term offense trend
Be the strongest suckers, be the fastest sickle.
BankOfChinaReview
How did it go? Out of 10 points, give a score!
View Original- Reward
- like
- 2
- Repost
- Share
LittleGod :
:
You sang well, but don't sing next time, minus 9 points.View More
- Reward
- like
- Comment
- Repost
- Share
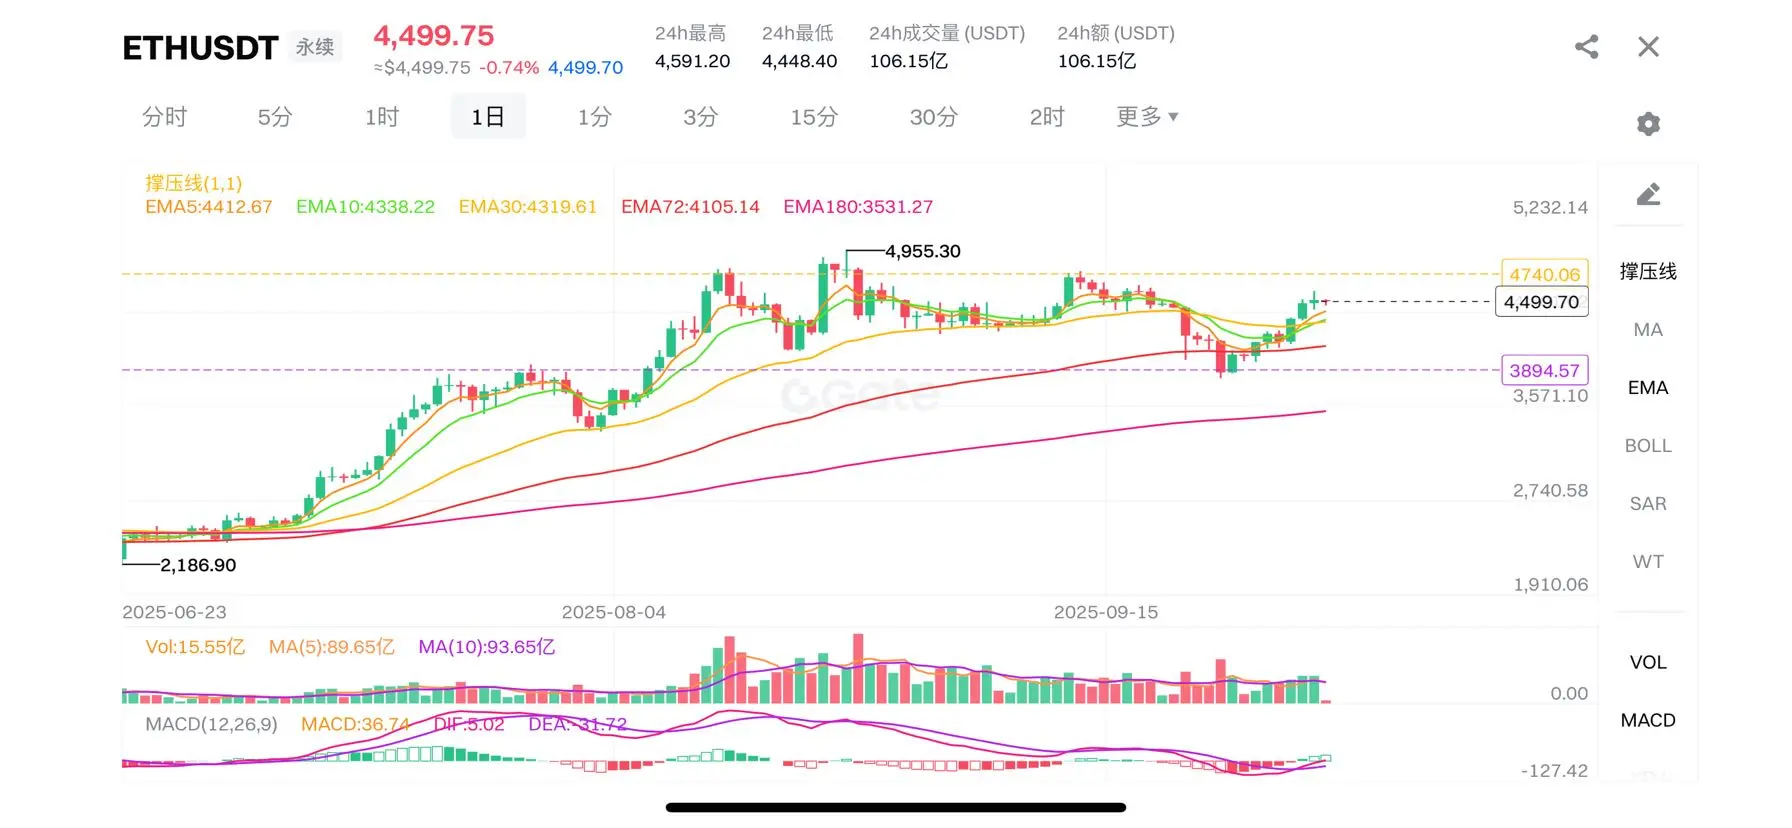
ETH Market Analysis on October 4
1. Trend Analysis
· The overall bullish pattern remains unchanged: the price is still above all EMAs, and the EMAs are in a bullish arrangement (EMA5 > EMA10 > EMA20 > EMA72 > EMA180)
· Short-term adjustment pressure: a pullback from the high of 4,740 to 4,499, a decline of about 5%, which is a normal technical correction.
· Moving Average Support System:
· Strong support 1: 4,412.67 (EMA5)
· Strong support 2: 4,338.22 (EMA10)
· Strong support 3: 4,319.61 (EMA20)
2. MACD Indicator Analysis
· Momentum is slowing but still biased to the upside: The MACD val
ETH1.97%
- Reward
- like
- Comment
- Repost
- Share
subscription tonight perfect returns!
View Original
- Reward
- like
- Comment
- Repost
- Share
- Reward
- like
- Comment
- Repost
- Share
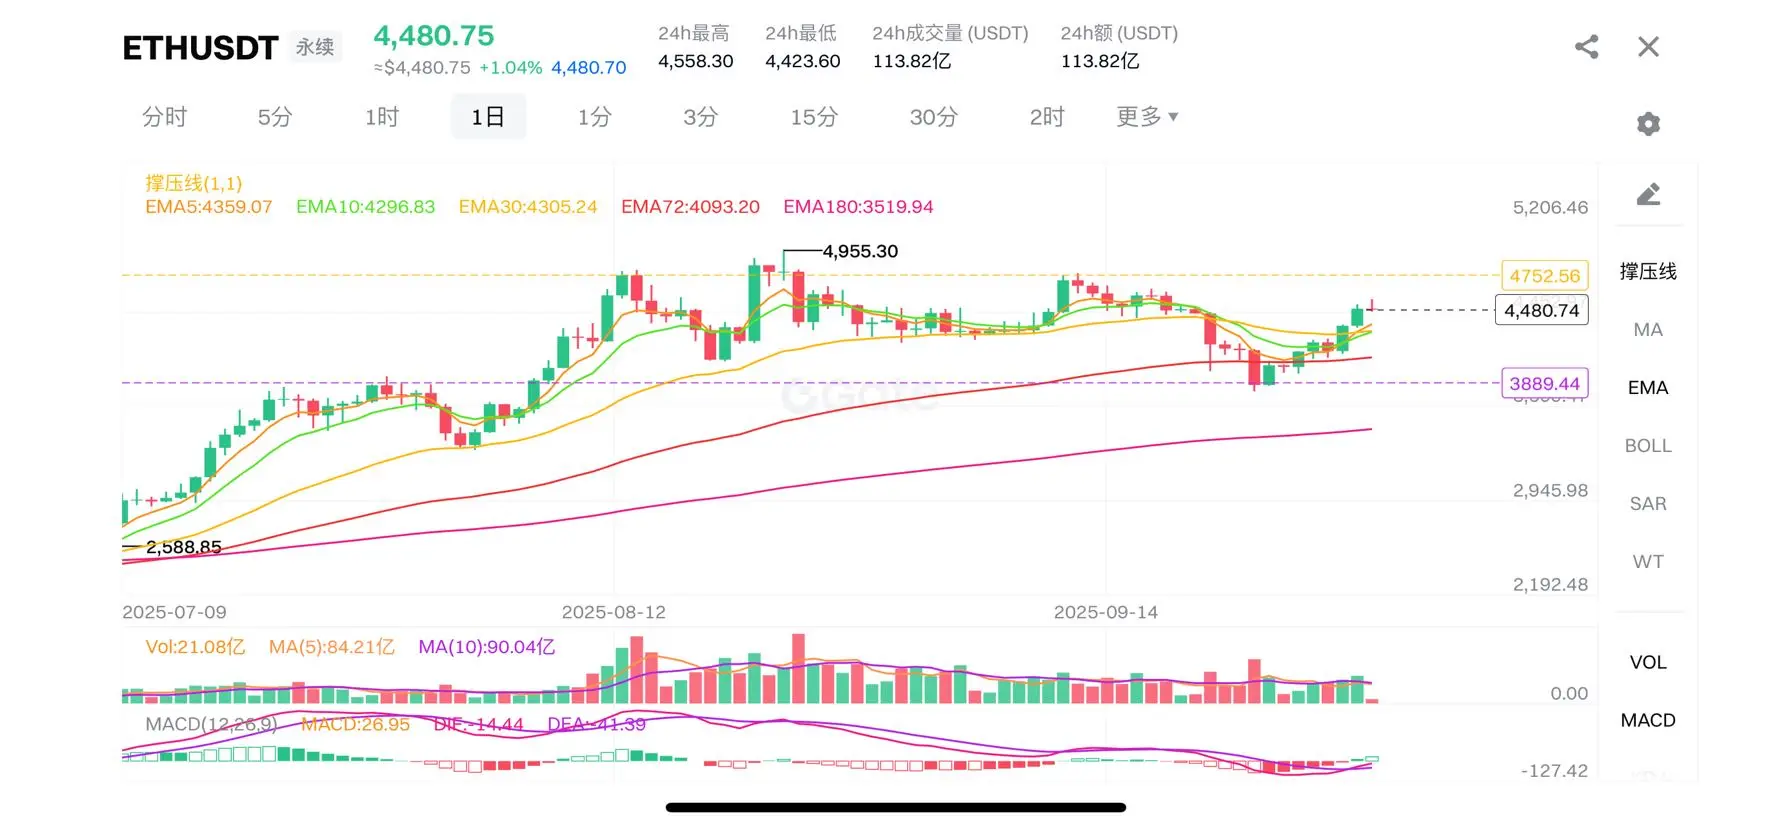
ETH Market Analysis on October 3
1. Trend Analysis
· Clear bullish pattern: Price is above all EMAs, showing a typical bullish arrangement.
· Strong support from moving averages:
· EMA5(4,359) > EMA10(4,297) > EMA30(4,305) > EMA72(4,093)
· Each period's EMA is diverging upwards, indicating a healthy trend
· Price position: Increased significantly from a low of 2,192 to 4,480, with an increase of over 100%, currently close to the previous high of 4,752.
2. MACD Indicator Analysis
· Golden Cross Signal Confirmation:
· DIF(-14.44) has crossed above DEA(-41.59)
· The MACD histogram has
ETH1.97%
- Reward
- like
- 2
- Repost
- Share
GateUser-8fc4f14b :
:
yes, you are really right, you are speaking correctly, it should be like that in my opinionView More
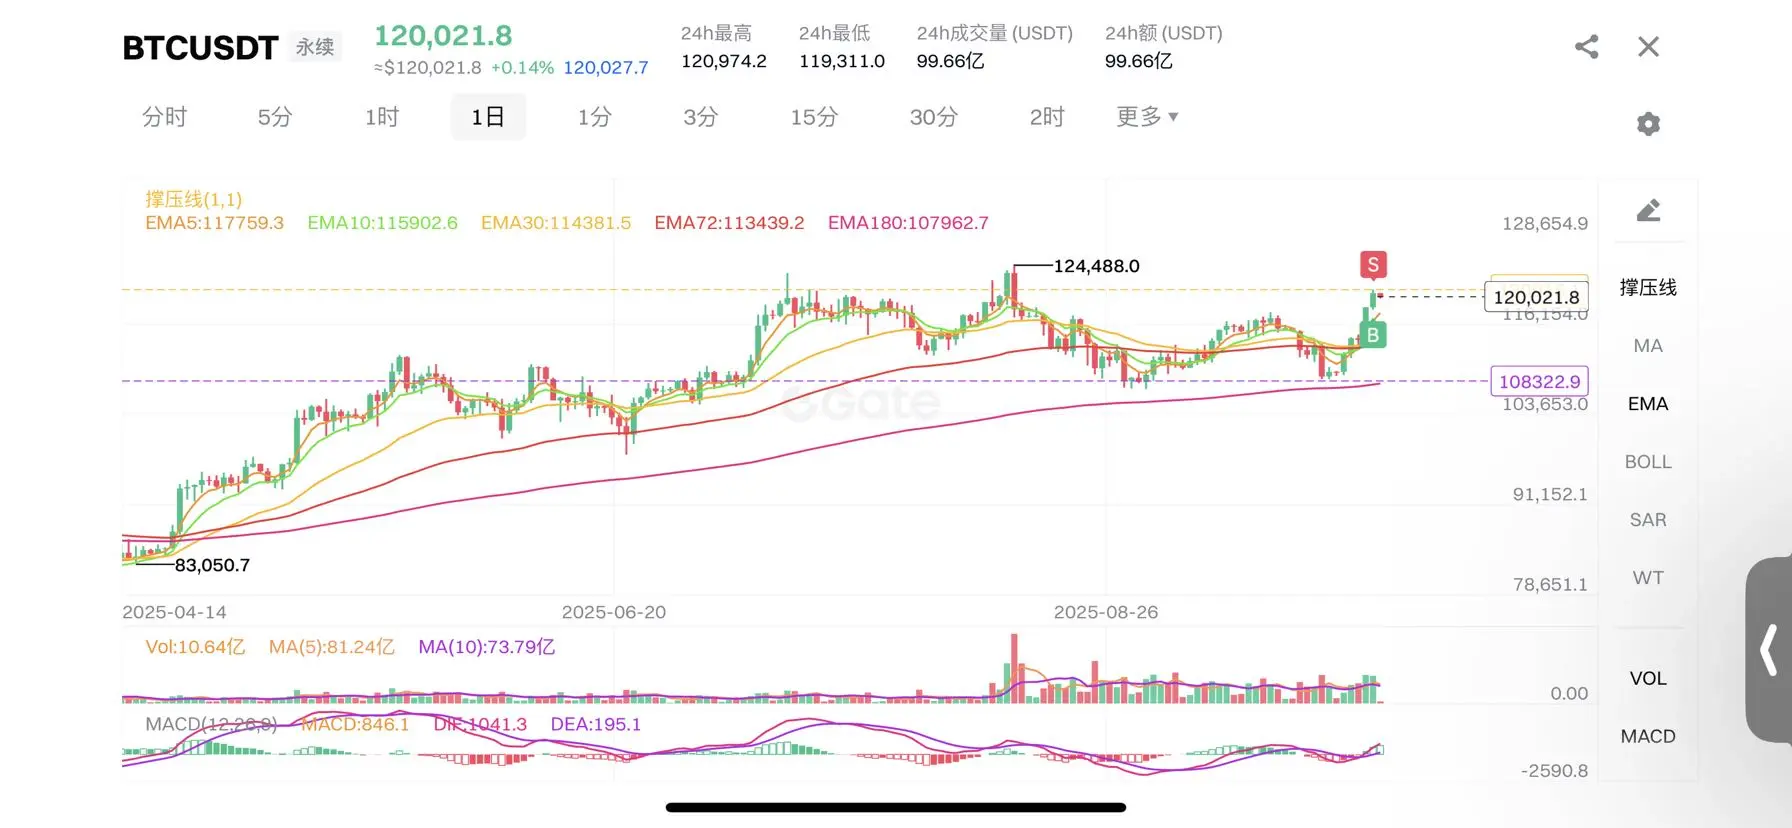
BTC Market Analysis for October 3
1. Trend Analysis
· Absolute bullish pattern: The price is above all EMAs, and the EMAs are in perfect bullish order (EMA5 > EMA10 > EMA30 > EMA72 > EMA180)
· Strong breakout: Rising from a low of 83,050.7 to 120,021.8, an increase of about 44.5%, indicating a strong upward trend.
· Price Position: The current price is close to the historical high of 124,488.0, situated in a key resistance area.
2. Moving Average System Analysis
· Bullish alignment complete: All period EMAs are diverging upwards, which is a typical characteristic of a bull market.
· Clear supp
BTC2.46%
- Reward
- 1
- 1
- Repost
- Share
LuRonggong :
:
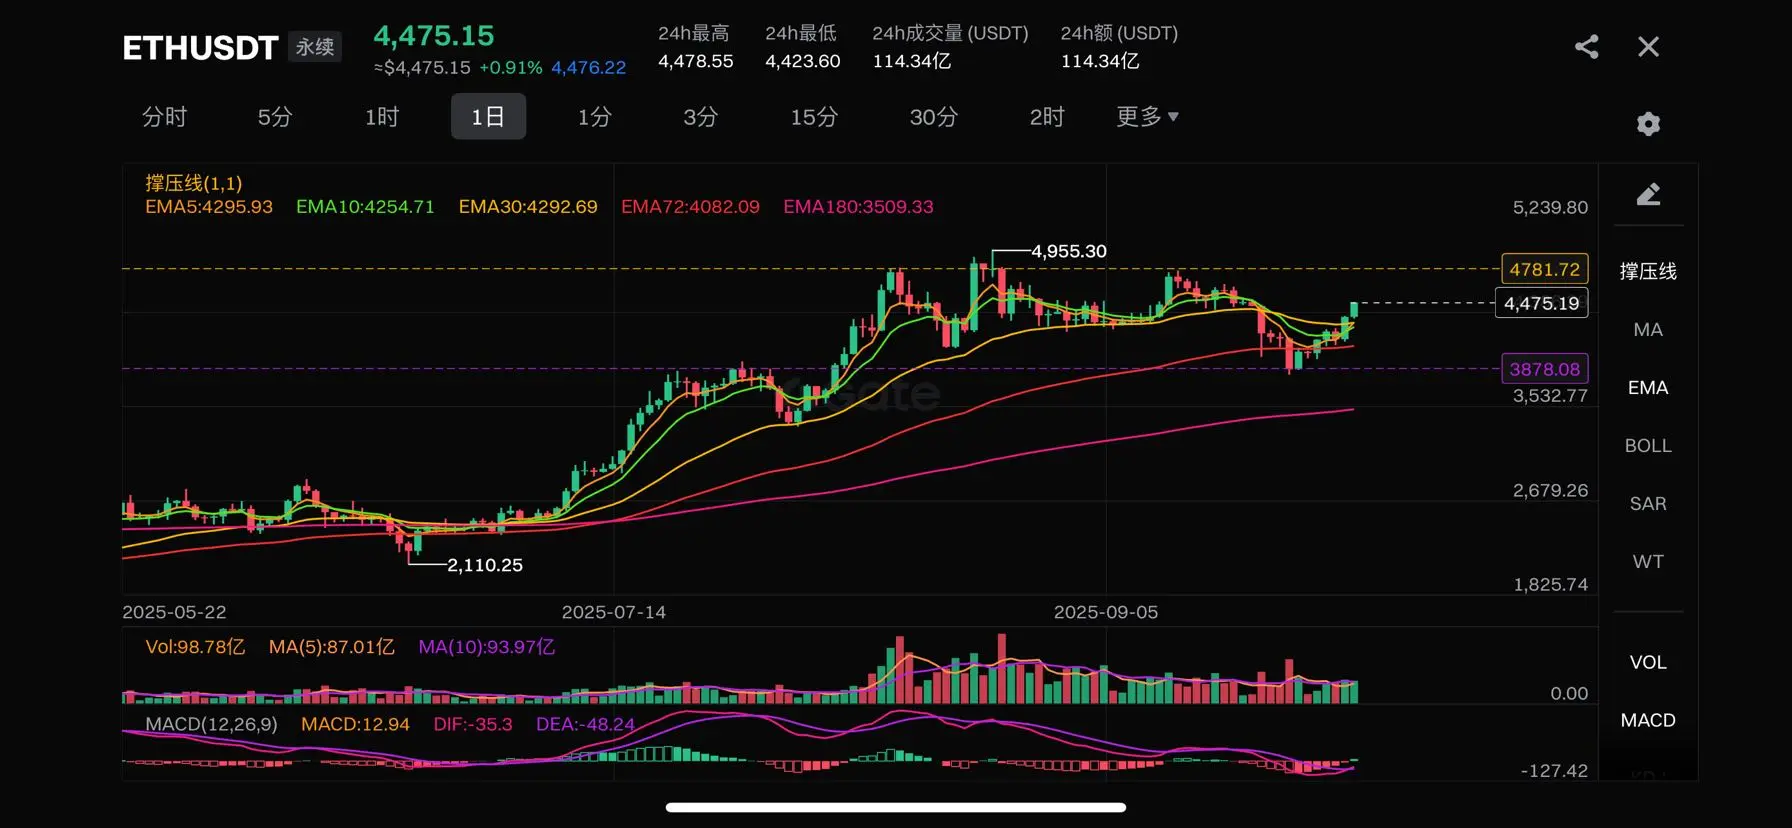
I don't like direct breakouts like from a 108k directly to 120k, I wanted BTC to spend some time and do consolidation before a 120k so I can buy on strength on the break of 120k but as it breakout directly so I'm not planning a breakout play on it or chasing it here.ETH Market Analysis on October 3rd
Comprehensive Technical Analysis
1. Trend and Position Analysis
· Long-term trend: Absolute bullish trend. The price is far above all major EMAs, especially the EMA180 (3509.33) which provides strong long-term support. From the price ladder at the bottom of the chart (from 1825 to 4955), ETH has already experienced a significant increase.
· Short-term trend: high-level fluctuations and corrections. The current price has retraced from the high of 4781.72 to 4475, which is a correction in the upward process. EMA5 and EMA30 are almost overlapping near 4295, indi
ETH1.97%
- Reward
- like
- 1
- Repost
- Share
Engin1979 :
:
hello ETHFİ- Reward
- like
- Comment
- Repost
- Share
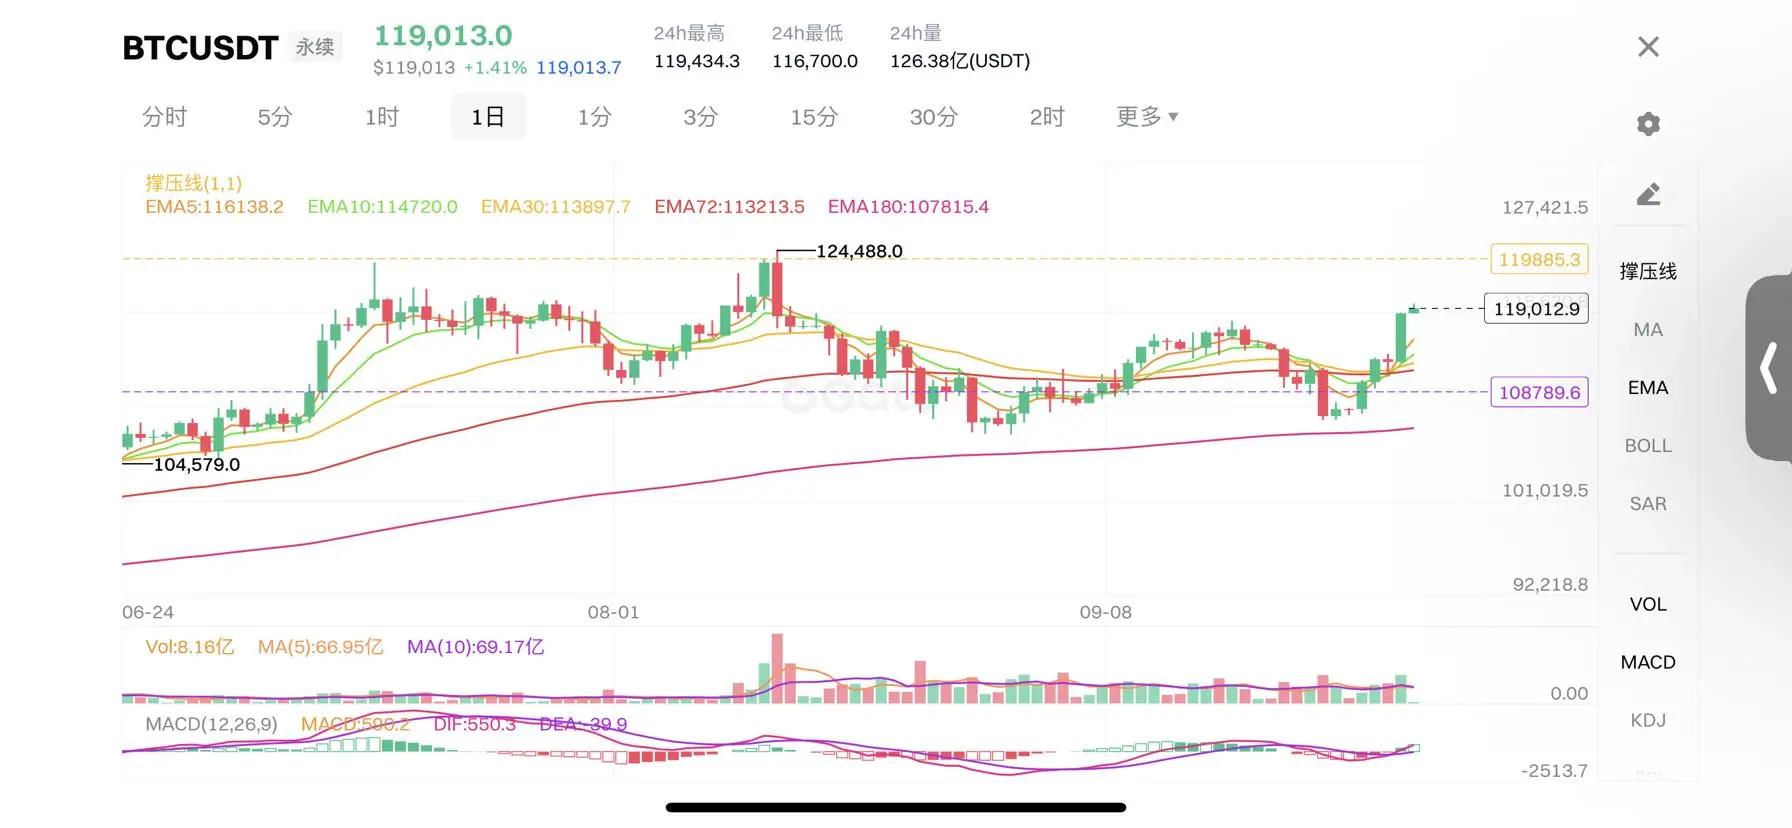
BTC Market Analysis on October 2
Current BTC price: 119,013.0 USDT, up 1.41%, close to the 24-hour high of 119,434.3 USDT.
· 24-hour range: 116,700.0 USDT (low) to 119,434.3 USDT (high).
· Trading Volume: 12.638 billion USDT, indicating a vibrant market.
· Exponential Moving Average (EMA):
· EMA30: 113,897.7 USDT (short-term trend)
· EMA72: 113,213.5 USDT (medium-term trend)
· EMA180: 107,815.4 USDT (long-term trend)
· The current price is above all EMAs, indicating an overall bullish trend.
· MACD Indicator:
· DIFF: 550.3, DEA: 49.0, DIFF is well above DEA, and MACD is in a strong b
BTC2.46%
- Reward
- 2
- Comment
- Repost
- Share
subscription content 30 minutes automatic take profit
View Original- Reward
- like
- Comment
- Repost
- Share
- Reward
- like
- Comment
- Repost
- Share
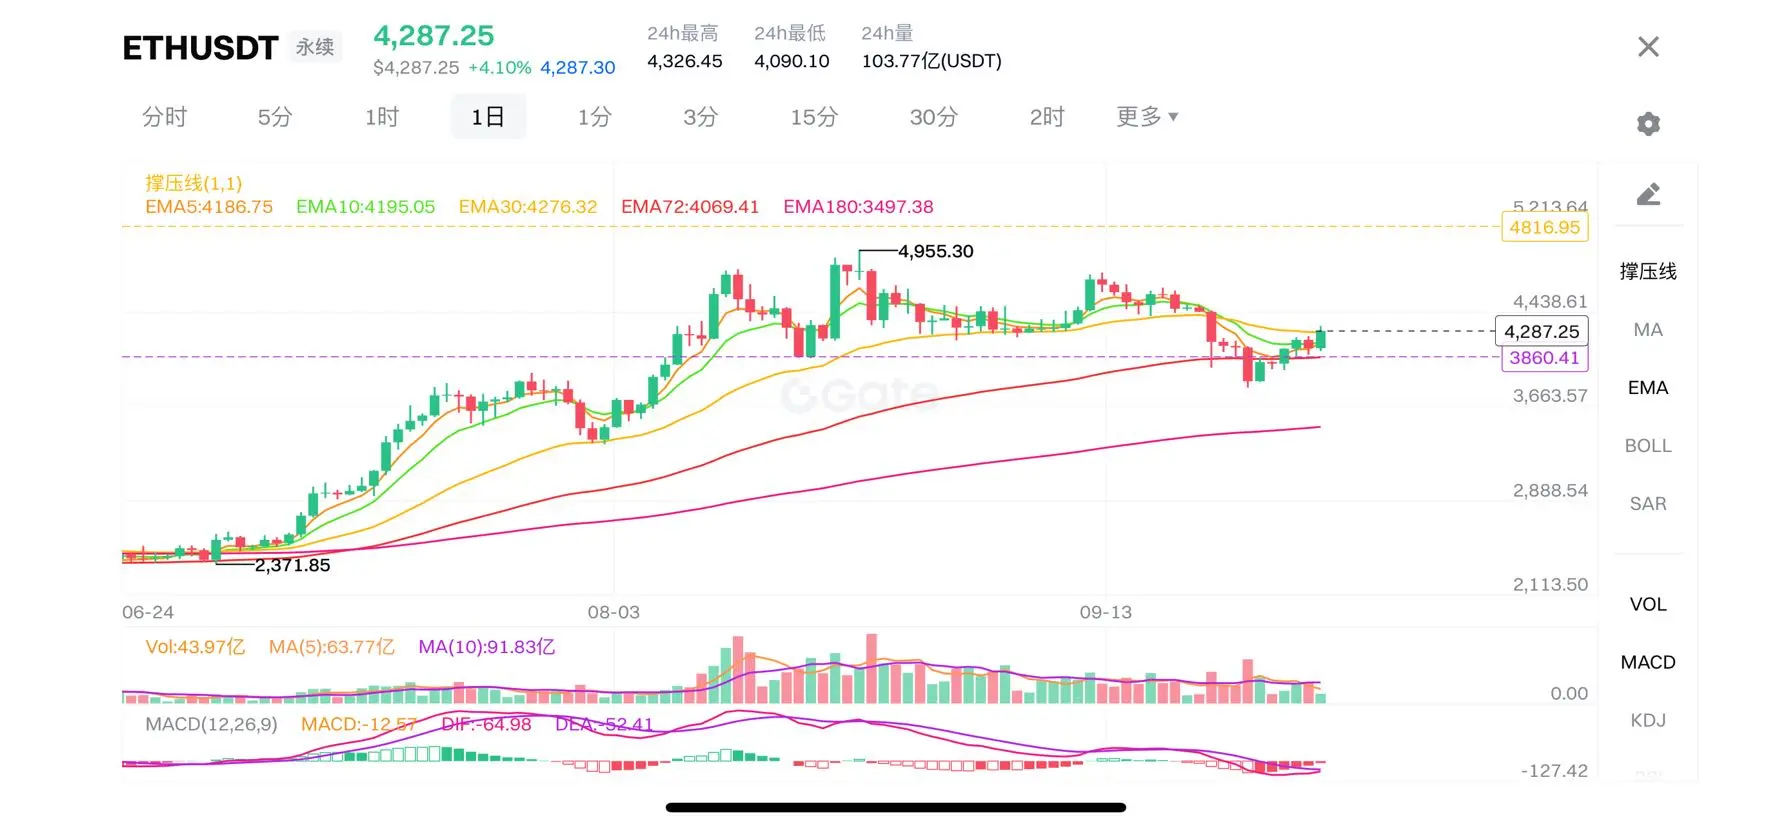
ETH Market Analysis on October 1
1. Core Features: Key Breakthrough
The most significant change is that ETH has shown a considerable upward candlestick (+4.10%), successfully breaking through the resistance of the two important short-term moving averages EMA5 (4186.75) and EMA10 (4195.05). This is a preliminary signal of a strengthening short-term trend.
2. Moving Average System (EMA) - Positive Change
· Short-term pressure has been broken: the price has risen above the EMA5 and EMA10, indicating that the short-term downtrend has been effectively halted, and the market's short-term m
ETH1.97%
- Reward
- like
- Comment
- Repost
- Share
subscription information automatic take profit
View Original
- Reward
- like
- Comment
- Repost
- Share
- Reward
- like
- 1
- Repost
- Share
Trade_Lp :
:
HODL tight 💪All the way!
Trading is difficult, and many times it makes you want to give up.
Trading is very simple, so simple that you can make money just by moving your fingers!
Countless nights I tossed and turned, unable to sleep, those unsettled warehouses, those stop losses that were hit, those indescribable liquidations, no one can understand, I can only bear it alone!
The process is dark and often desperate, but a glimmer of hope and light in my heart tells me I can! Some say I am gambling! Yes! I am gambling with my future!
Because once you gain insight into trading, all the suffering will eventua
View OriginalTrading is difficult, and many times it makes you want to give up.
Trading is very simple, so simple that you can make money just by moving your fingers!
Countless nights I tossed and turned, unable to sleep, those unsettled warehouses, those stop losses that were hit, those indescribable liquidations, no one can understand, I can only bear it alone!
The process is dark and often desperate, but a glimmer of hope and light in my heart tells me I can! Some say I am gambling! Yes! I am gambling with my future!
Because once you gain insight into trading, all the suffering will eventua

- Reward
- like
- Comment
- Repost
- Share
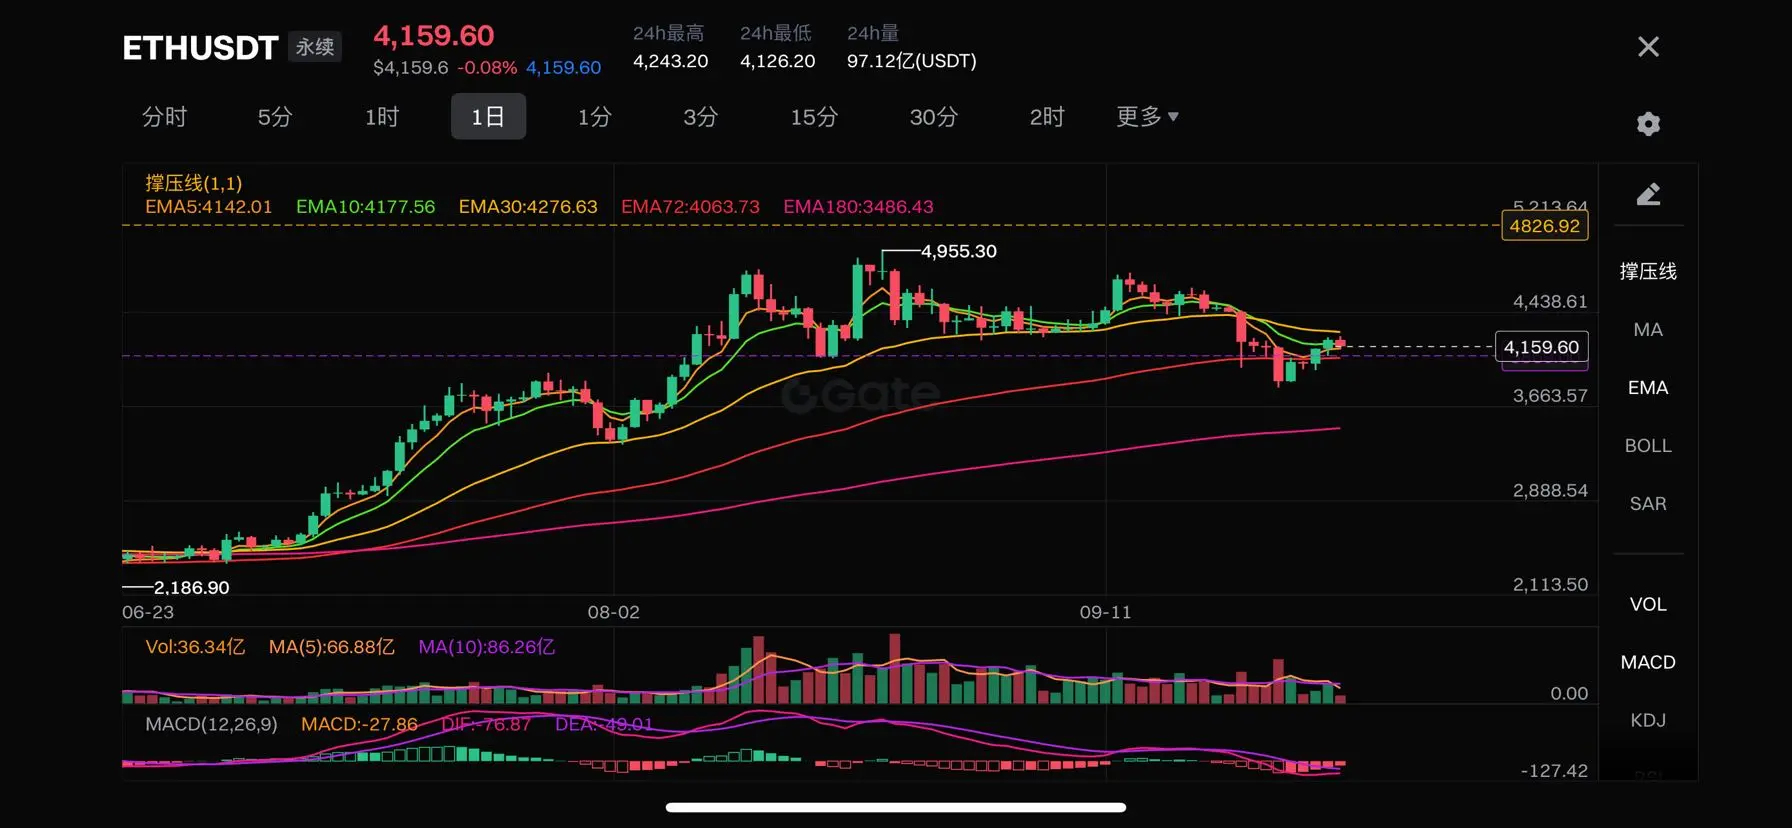
ETH Market Analysis on September 30
1. Macroeconomic Trends: The chart shows that after ETH reached a high of ~4,955 USDT, it entered a complex phase of retracement and fluctuation. The overall structure has not broken below the cornerstone of the long-term uptrend.
2. Current position: Latest price 4,159.60 USDT, nearly flat (-0.09%). The price is at an extremely critical technical point, which is the battleground between the short-term and mid-term trends.
3. Moving Average System (EMA) - Core Focus:
· Short-term pressure: The price is operating near the short-term moving averages EMA5 (4
ETH1.97%
- Reward
- like
- 1
- Repost
- Share
Mrson :
:
yes, today it can be a bit clearer.. the trend may adjust slightly and continue to growLet's see if it can double tomorrow! Or stop loss!
View OriginalSubscribers Only
Subscribe now to view exclusive content- Reward
- like
- Comment
- Repost
- Share
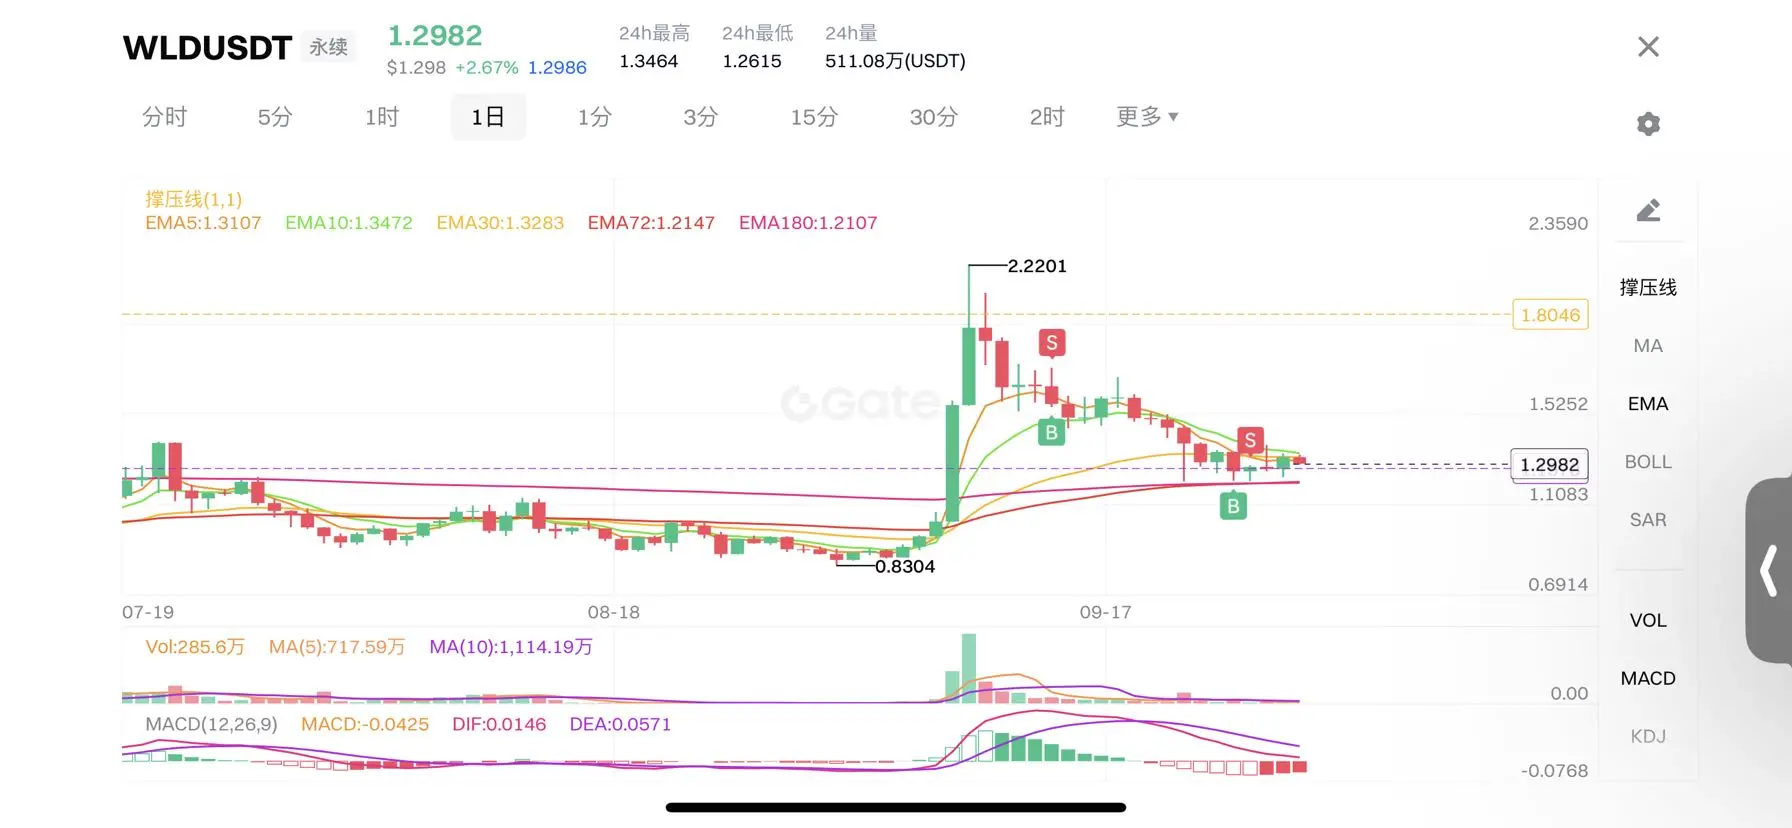
September 29 WLD Market Analysis
Technical Analysis
1. Trend and Position Analysis
· Moving Average System: The current price is below all short-term moving averages (EMA5, EMA10, EMA30), but above the key medium to long-term moving averages (EMA72/180). This indicates:
· Short-term trend: Clear bearish, facing pullback pressure.
· Medium to long-term trend: Still maintaining above key support, the overall structure is not damaged, and the general direction can still be viewed as bullish.
· Price Position: The price is at a critical end of a triangular convergence or rectangular consolid
WLD-0.42%
- Reward
- 2
- 1
- Repost
- Share
Aegis :
:
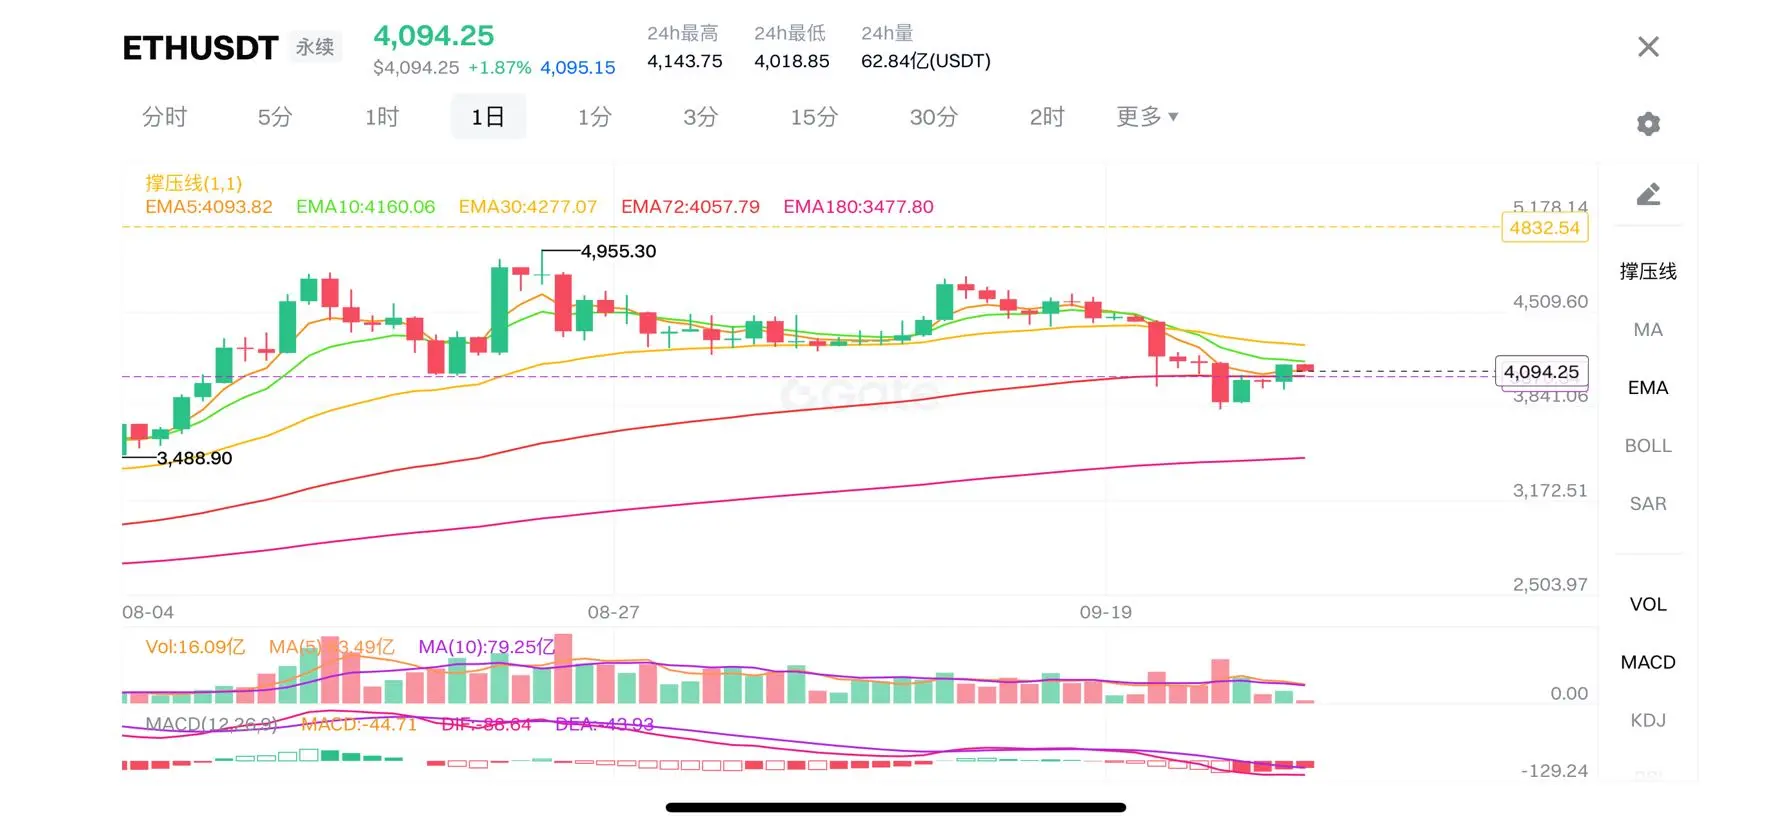
Hold on to HODL💎ETH September 29 Analysis
Trend Analysis
1. Relationship between price and EMA:
The current price (4,094.25) is below the short-term EMA (EMA5: 4083.82, EMA10: 4160.06, EMA20: 4277.07), indicating that the short-term trend is weak or in a correction phase. The price has failed to break through the short-term moving averages, showing that selling pressure is still present.
However, the price is above the medium to long-term EMA (EMA72: 4057.79, EMA180: 3477.80), which indicates that the medium to long-term trend is still bullish. EMA72 (around 4058) is a key support level, and if it holds,
ETH1.97%
- Reward
- like
- Comment
- Repost
- Share

