Trade
Trading Type
Spot
Trade crypto freely
Alpha
Points
Get promising tokens in streamlined on-chain trading
Pre-Market
Trade new tokens before they are officially listed
Margin
Magnify your profit with leverage
Convert & Block Trading
0 Fees
Trade any size with no fees and no slippage
Leveraged Tokens
Get exposure to leveraged positions simply
Futures
Futures
Hundreds of contracts settled in USDT or BTC
Options
HOT
Trade European-style vanilla options
Unified Account
Maximize your capital efficiency
Demo Trading
Futures Kickoff
Get prepared for your futures trading
Futures Events
Participate in events to win generous rewards
Demo Trading
Use virtual funds to experience risk-free trading
Earn
Launch
Investment
Simple Earn
VIP
Earn interests with idle tokens
Auto-Invest
Auto-invest on a regular basis
Dual Investment
Buy low and sell high to take profits from price fluctuations
Quant Fund
VIP
Top asset management team helps you profit without hassle
Crypto Loan
0 Fees
Pledge one crypto to borrow another
Lending Center
One-Stop Lending Hub
VIP Wealth Hub
New
Customized wealth management empowers your assets growth
Private Wealth Management
Customized asset management to grow your digital assets
Staking
Stake cryptos to earn in PoS products
BTC Staking
HOT
Stake BTC and earn 10% APR
GUSD Minting
New
Use USDT/USDC to mint GUSD for treasury-level yields
Soft Staking
Earn rewards with flexible staking
More


- Trending TopicsView More
8.3K Popularity
3K Popularity
60.6K Popularity
17.1K Popularity
190.3K Popularity
- Hot Gate FunView More
- MC:$80.1KHolders:107
- MC:$53.4KHolders:1791
- MC:$32.4KHolders:218
- MC:$28KHolders:60609646
- MC:$26.6KHolders:2325
- Pin
- 🚀 Gate Fun Chinese Meme Fever Keeps Rising!
Create, launch, and trade your own Meme tokens to share a 3,000 GT!
Post your Meme on Gate Square for a chance to win $600 in sharing rewards!
A total prize pool of $3,600 awaits all creative Meme masters 💥
🚀 Launch now: https://web3.gate.com/gatefun?tab=explore
🏆 Square Sharing Prizes:
1️⃣ Top Creator by Market Cap (1): $200 Futures Voucher + Gate X RedBull Backpack + Honor Poster
2️⃣ Most Popular Creator (1): $200 Futures Voucher + Gate X RedBull Backpack + Honor Poster
3️⃣ Lucky Participants (10): $20 Futures Voucher (for high-quality posts)
O - 📢 Gate Square Ambassador Recruitment is Now Open! 🔥
Join Gate Ambassadors for more than just creating — embark on an exciting journey! 💡
As a Square Ambassador, you’ll enjoy:
🎁 Exclusive perks to showcase your unique value
💰 Square task alerts — earn rewards while posting
🎨 Limited-edition merch — become an official Gate representative
⭐ VIP5 status + Square Yellow V badge — stand out with ease
🚀 Join us and become:
A community influencer
A Web3 creative pioneer
A promoter of quality content
🎉 Click to apply and start your ambassador journey: https://www.gate.com/questionnaire/4937
📖 - Gate App Options Now Live! Test and Win Big
📅 Event Period: September 30, 2025 – October 17, 2025
- Submit valid feedback to receive 10–100 USDT.
- Complete at least 10,000 USDT in cumulative options trading volume to participate.
👉 Register now :https://www.gate.com/campaigns/2063
Details: https://www.gate.com/zh-tw/announcements/article/47455
6 Major Shiba Inu (SHIB) Indicators Are Green: Uptrend Coming?
For Shiba Inu, a number of on-chain indicators are displaying early bullish signals, suggesting that an uptrend may be imminent despite the chart's recent lackluster performance.
Despite price action remaining flat at $0.0000119, six key network and exchange metrics have turned positive over the past day, according to recent on-chain data, indicating a healthier underlying market structure.
Netflows normalize
With a -38.5 billion SHIB movement, the Exchange Netflow (Total) shows the most significant change. This suggests that investors are putting their holdings into cold storage rather than getting ready to sell, as there is a net outflow of tokens from exchanges, which is a generally bullish indication. The trend of declining supply on trading platforms has been reinforced by the exchange reserves' decline at the same time.
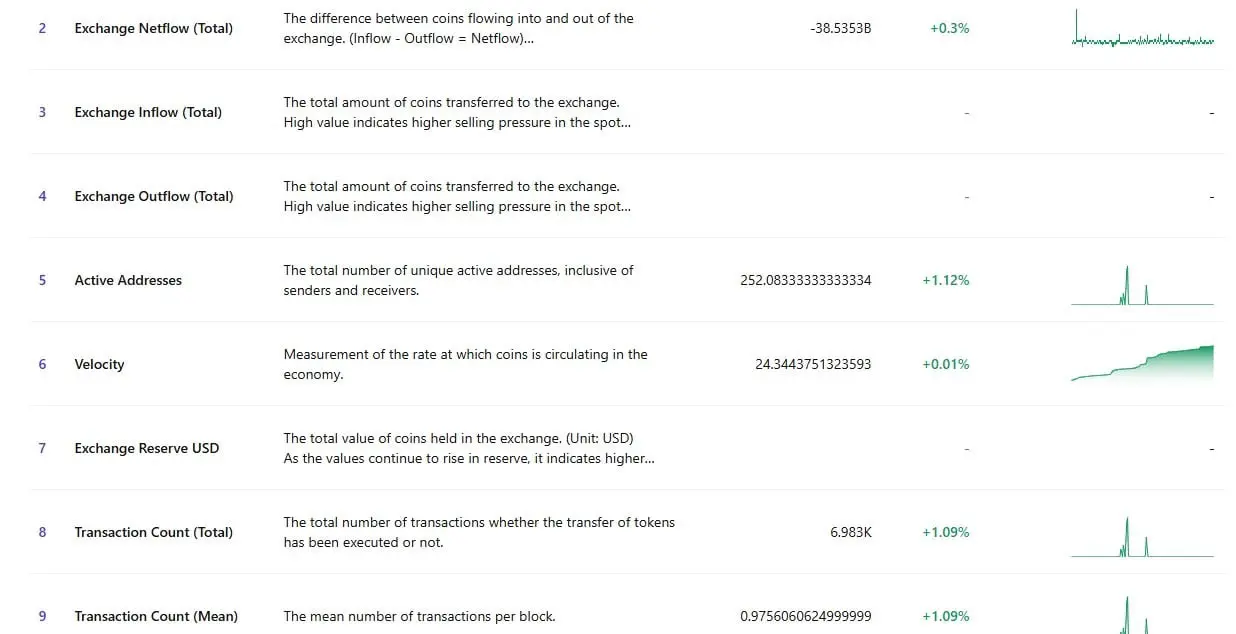
Additionally, network activity is increasing. There are now over 252 distinct addresses, an increase of 1.12% in the number of active addresses. When combined with a rising transaction count, which has increased by 1.09%, indicating growing transactional utility within the ecosystem, this increase in wallet activity frequently precedes stronger market participation.
Velocity, which gauges how regularly tokens move throughout the economy, is another encouraging metric. A slight increase in SHIB's velocity indicates that holders are beginning to interact with the asset again, which is a prerequisite for the beginning of a long-term reversal.
SHIB limits
However, a multimonth descending triangle that can be seen on the daily chart technically still limits SHIB. The RSI is circling 43, indicating weak momentum and the token is still below its 50-day and 100-day EMAs. Any bullish continuation would need to be validated by a confirmed breakout above the $0.0000124-$0.0000128 zone.
Price action is trailing behind SHIB's fundamentals, which are generally displaying subtle strength. The framework for a recovery rally may already be taking shape if these on-chain metrics keep getting better, which would pave the way for a possible trend reversal later in Q4, 2025.