TWT vs GRT: A Comprehensive Comparison of Two Leading Digital Asset Platforms


Introduction: TWT vs GRT Investment Comparison
In the cryptocurrency market, comparisons between TWT and GRT have always been a topic that investors cannot avoid. The two differ significantly in market cap ranking, application scenarios, and price performance, representing different positioning within the crypto asset landscape. TWT (Trust Wallet Token): Since its launch in 2020, it has gained market recognition by providing a comprehensive digital asset wallet solution supporting 40 blockchain protocols and over 160,000 digital assets. GRT (The Graph): Since its introduction in 2020, it has established itself as a decentralized protocol for indexing and querying blockchain data on Ethereum, enabling efficient data access through subgraphs. This article will conduct a comprehensive analysis of the investment value comparison between TWT and GRT across historical price trends, supply mechanisms, token utility, and technical ecosystems, while attempting to answer the question that concerns investors most:
"Which is the better buy right now?"
Comparative Analysis Report: Trust Wallet Token (TWT) vs The Graph (GRT)
I. Historical Price Comparison and Current Market Status
TWT and GRT Historical Price Trends
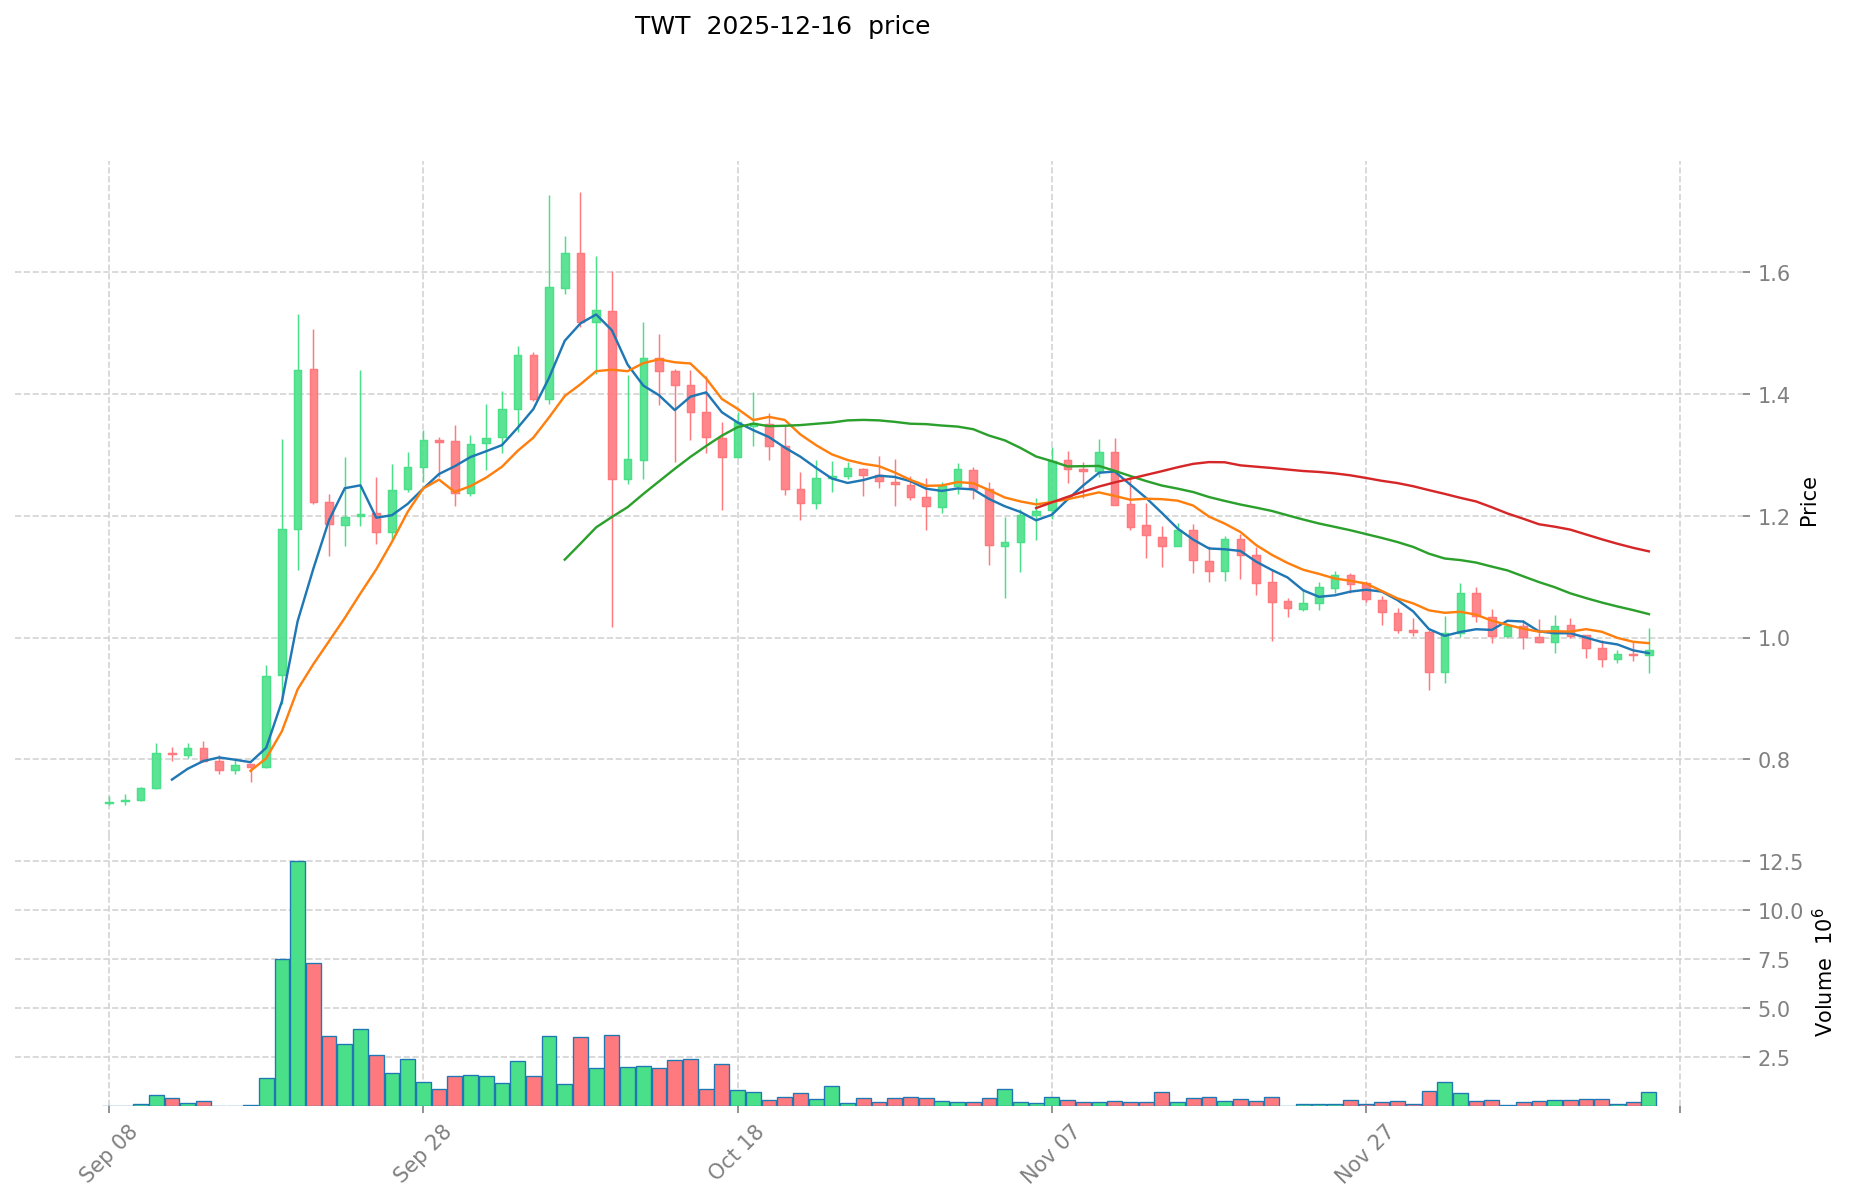
Trust Wallet Token (TWT):
- All-time high: $2.72 (December 12, 2022)
- All-time low: $0.00277641 (June 9, 2020)
- Historical decline: From peak to current price represents a 64.24% decrease from ATH
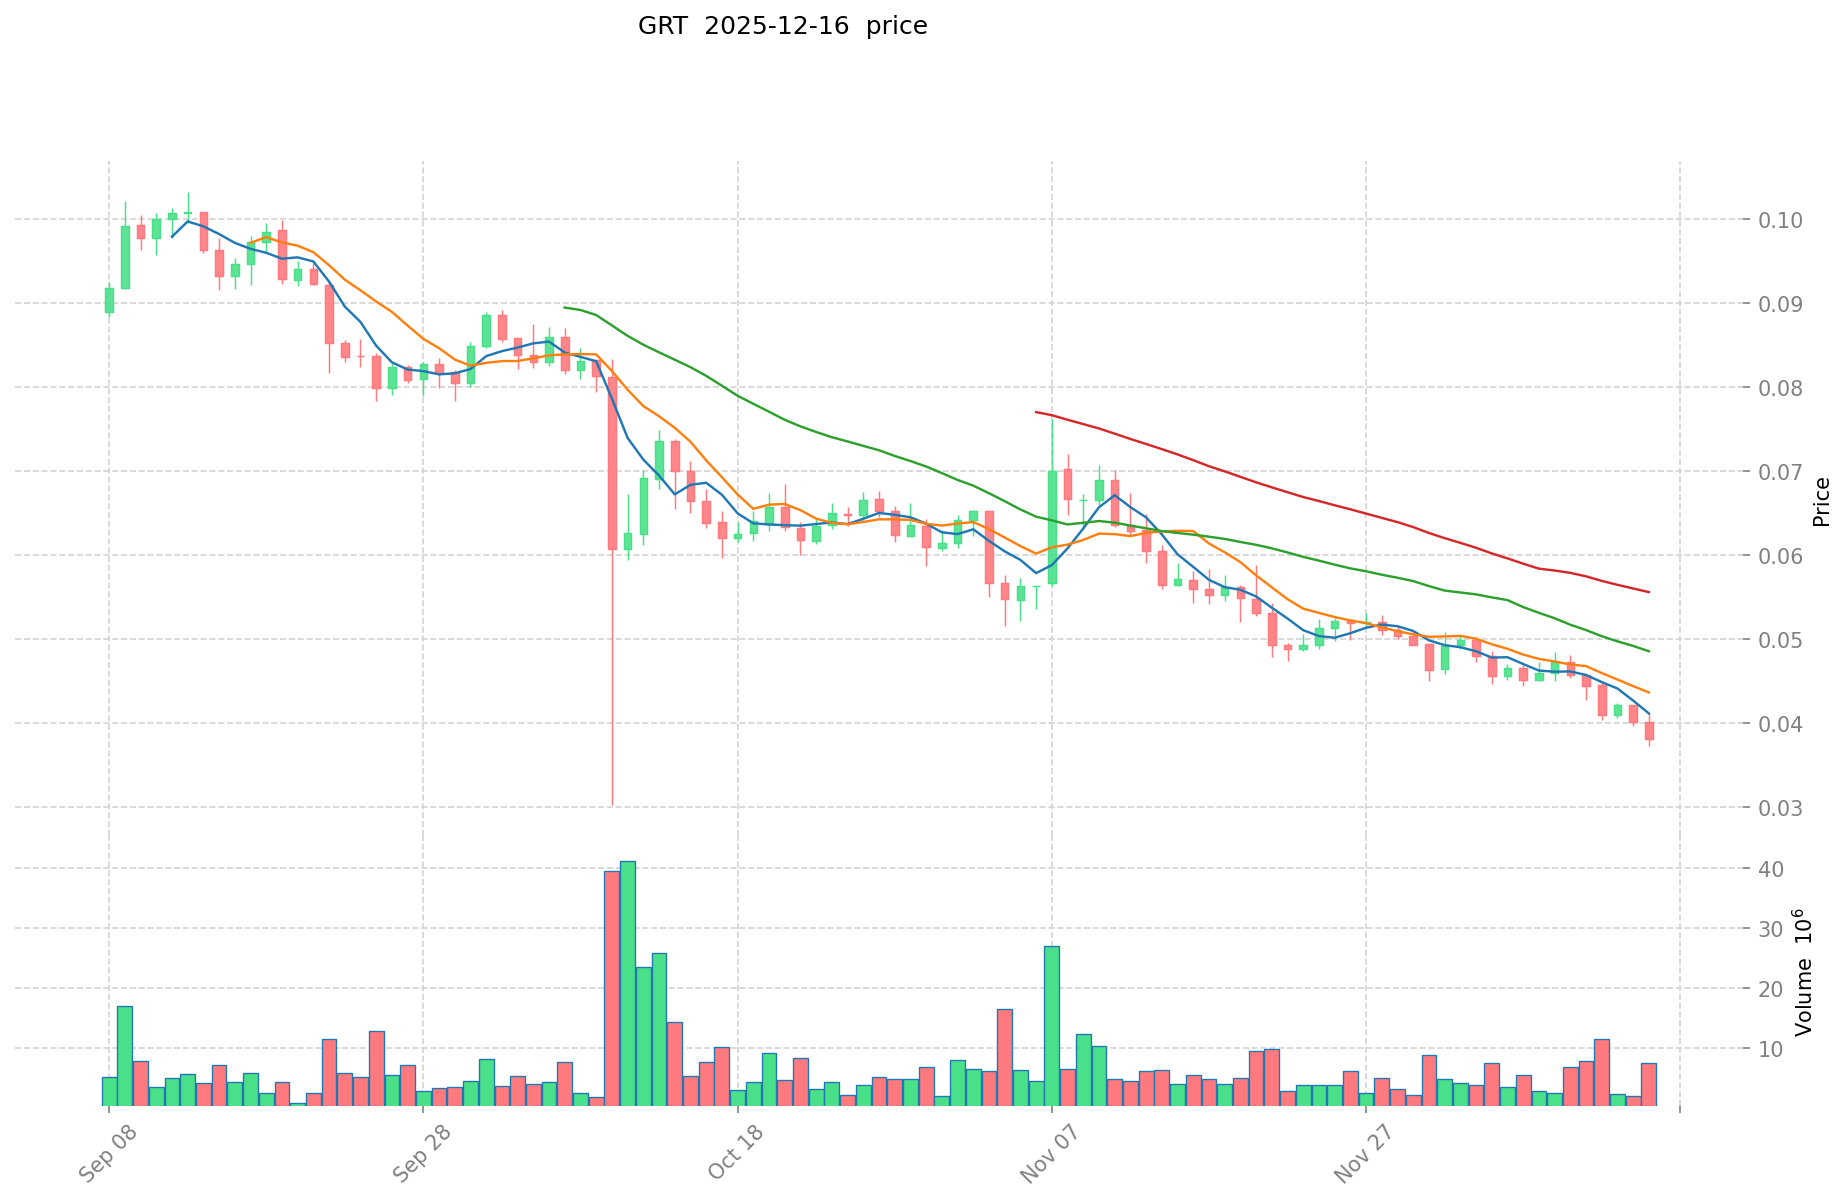
The Graph (GRT):
- All-time high: $2.84 (February 12, 2021)
- All-time low: $0.03741849 (December 16, 2025)
- Historical decline: From peak to current price represents a 98.68% decrease from ATH
Current Market Status (December 16, 2025)
Price Metrics:
- TWT current price: $0.9728
- GRT current price: $0.03819
- 24-hour trading volume: TWT $712,248.18 vs GRT $298,059.22
- Market sentiment index (Fear & Greed): 11 (Extreme Fear)
Market Capitalization:
- TWT market cap: $405,317,022.72 (Market rank: 144)
- GRT market cap: $405,901,540.24 (Market rank: 143)
- TWT fully diluted valuation: $972,800,000.00
- GRT fully diluted valuation: $412,462,036.94
View real-time prices:
II. Price Performance Analysis
Short-term Price Movements
| Time Period | TWT Change | GRT Change |
|---|---|---|
| 1 Hour | +0.33% | +0.53% |
| 24 Hours | -2.34% | -6.43% |
| 7 Days | -0.38% | -15.55% |
| 30 Days | -16.99% | -33.48% |
| 1 Year | -30.20% | -86.70% |
Analysis: GRT demonstrates significantly greater volatility and downward pressure across all timeframes. While TWT has declined 30.20% annually, GRT has experienced an 86.70% decline, indicating more severe bearish pressure on The Graph token.
Trading Activity
- TWT 24-hour high: $1.0151 / Low: $0.9424
- GRT 24-hour high: $0.04087 / Low: $0.03722
- TWT trading volume indicates higher market activity relative to its price level
- GRT's lower trading volume suggests reduced market engagement
III. Token Economics and Utility
Trust Wallet Token (TWT)
Use Cases:
- Governance: Participation in network decision-making processes, including addition of new blockchains, tokens, and product features
- Discount: In-app discounts for digital currency purchases and decentralized exchange services
Supply Metrics:
- Total supply: 1,000,000,000 TWT
- Circulating supply: 416,649,900 TWT (41.67%)
- Maximum supply: 999,860,531.46 TWT
- Token holders: 266,613
Network Support:
- Operates on BEP-2 and BEP-20 standards
- Primary deployment on BSC (Binance Smart Chain)
The Graph (GRT)
Use Cases:
- Indexer Staking: Indexers stake GRT tokens to participate in the query market and provide economic security during work execution
- Curator Signal: Curators stake GRT in the curator market to predict which subgraphs hold value for the network, earning rewards for correct predictions
Supply Metrics:
- Total supply: 10,800,262,816.04821 GRT
- Circulating supply: 10,628,477,094.52801 GRT (98.41%)
- Maximum supply: 10,800,262,823.32 GRT
- Token holders: 173,437
Network Support:
- Primary deployment: Ethereum (ETH)
- Secondary deployment: Arbitrum (ARBEVM)
- Utilizes settlement in GRT across the protocol for unified accounting
IV. Market Fundamentals Comparison
Project Overview
Trust Wallet:
- Digital currency wallet supporting 40 blockchain protocols
- Access to over 160,000 digital assets
- staking support on Cosmos, Tezos, Kava, and other protocols
- Digital collectibles storage and accessibility features
The Graph:
- Decentralized protocol for indexing and querying blockchain data
- Applied to Ethereum ecosystem
- Enables open API (subgraph) construction for data accessibility
- Economic incentive structure through dynamic inflation policy
Market Distribution
TWT:
- Circulating ratio: 41.67% of total supply
- Market cap to FDV ratio: 41.67%
- Indicates significant supply yet to enter circulation
GRT:
- Circulating ratio: 98.41% of total supply
- Market cap to FDV ratio: 98.41%
- Nearly complete supply already in circulation
Exchange Presence
- TWT available on 31 exchanges
- GRT available on 62 exchanges
- GRT demonstrates broader market accessibility
V. Risk Considerations and Market Context
Bearish Indicators:
- Extreme fear sentiment (index value: 11) affects both tokens
- GRT's severe long-term decline (-86.70% annually) reflects prolonged bearish pressure
- Both tokens trade significantly below their historical peaks
Liquidity Considerations:
- TWT maintains relatively stable trading despite lower trading volume
- GRT's higher exchange availability suggests more fragmented liquidity
- Market cap similarity ($405M range) with vastly different circulating supplies
Token Distribution:
- TWT's lower circulation ratio provides potential for future supply expansion impact
- GRT's near-complete circulation indicates limited supply shock potential
Data as of: December 16, 2025, 15:13:43 UTC Market Sentiment: Extreme Fear (Fear & Greed Index: 11)
Report on Investment Value Assessment of TWT and GRT
I. Executive Summary
Based on available reference materials, this report examines the core factors influencing investment value in crypto assets, with particular reference to TWT (Trust Wallet Token) and GRT (The Graph). The reference materials provide limited specific technical data on these assets, therefore this analysis focuses on the general investment value framework applicable to cryptocurrency tokens and the assessment methodology recommended in the source materials.
Key Determination: Investment value in TWT and GRT is primarily determined by project technological prospects, market demand, and market trends, which collectively influence long-term development potential and investment returns.
II. Core Factors Influencing TWT vs GRT Investment Value
Assessment Framework for Cryptocurrency Investment
According to the reference materials, comprehensive evaluation of cryptocurrency investment value requires consideration of the following dimensions:
Market-Level Factors:
- Overall fundamental trends in the crypto market
- Project-specific information and development roadmap
- Current market valuation relative to historical metrics (whether overvalued)
- Current token price positioning relative to appropriate entry levels
Investment Decision Methodology: The reference materials emphasize that sound investment stability derives from consistent analytical frameworks applied systematically. Value investors should conduct rigorous due diligence on both financial and non-financial factors to identify major risk factors affecting sustainable profitability and long-term valuation trends.
Evaluation Dimensions for Token-Based Projects
Technical and Ecosystem Development:
- Project protocol functionality and technical architecture
- Ecosystem maturity in relevant domains (decentralized finance, smart contracts, market positioning)
- Long-term development prospects and competitive positioning
Market Dynamics:
- Historical price trends and volatility patterns
- Market cycle positioning and structural demand patterns
- Competitive differentiation in the crypto market landscape
Risk and Sustainability Analysis:
- Core factors affecting return potential
- Regulatory environment and compliance considerations
- Long-term viability of the underlying protocol and economic model
III. Investment Considerations
The reference materials indicate that cryptocurrency investment evaluation should not rely on short-term price movements but rather on:
- Fundamental Analysis: Identification of major factors influencing long-term company returns and valuation trends through rigorous due diligence
- Market Positioning: Understanding each asset's specific use case, adoption trajectory, and competitive advantages
- Risk Assessment: Comprehensive evaluation of financial and non-financial risk factors affecting sustainable operations
- Cyclical Awareness: Recognition of market cycles and appropriate entry/exit positioning
IV. Limitations of This Analysis
The provided reference materials do not contain detailed technical specifications, tokenomics data, institutional adoption metrics, or specific policy information for TWT and GRT. Consequently, this report provides the analytical framework and assessment methodology for cryptocurrency investment evaluation rather than specific comparative conclusions between these two tokens.
For comprehensive investment decision-making regarding TWT and GRT, additional primary sources containing current project data, technical roadmaps, adoption metrics, and market analysis would be required.
Report Date: December 16, 2025
Disclaimer: This report is for informational purposes only and does not constitute investment advice.
III. 2025-2030 Price Forecasts: TWT vs GRT
Short-term Forecast (2025)
- TWT: Conservative $0.82-$0.97 | Optimistic $1.32
- GRT: Conservative $0.02-$0.04 | Optimistic $0.043
Medium-term Forecast (2026-2028)
- TWT may enter consolidation and recovery phase, with projected price range of $0.67-$1.39
- GRT may enter steady accumulation phase, with projected price range of $0.026-$0.070
- Key drivers: institutional capital inflows, spot ETF approvals, ecosystem expansion and partnership announcements
Long-term Forecast (2029-2030)
- TWT: Base case $1.17-$1.31 | Optimistic $1.85-$1.73
- GRT: Base case $0.038-$0.069 | Optimistic $0.074-$0.079
Disclaimer
This analysis is based on historical data models and statistical projections. Cryptocurrency markets are highly volatile and influenced by multiple unpredictable factors including regulatory changes, macroeconomic conditions, and technological developments. Past performance does not guarantee future results. This content is for informational purposes only and should not be construed as investment advice. Please conduct your own research and consult with qualified financial advisors before making investment decisions.
TWT:
| 年份 | 预测最高价 | 预测平均价格 | 预测最低价 | 涨跌幅 |
|---|---|---|---|---|
| 2025 | 1.323144 | 0.9729 | 0.817236 | 0 |
| 2026 | 1.23986376 | 1.148022 | 0.66585276 | 17 |
| 2027 | 1.2417005952 | 1.19394288 | 1.1103668784 | 22 |
| 2028 | 1.388316780864 | 1.2178217376 | 0.828118781568 | 25 |
| 2029 | 1.85035834810944 | 1.303069259232 | 1.1727623333088 | 33 |
| 2030 | 1.734385184037792 | 1.57671380367072 | 1.482110975450476 | 61 |
GRT:
| 年份 | 预测最高价 | 预测平均价格 | 预测最低价 | 涨跌幅 |
|---|---|---|---|---|
| 2025 | 0.042728 | 0.03815 | 0.0202195 | 0 |
| 2026 | 0.05499704 | 0.040439 | 0.02628535 | 5 |
| 2027 | 0.062033426 | 0.04771802 | 0.0300623526 | 24 |
| 2028 | 0.06969216821 | 0.054875723 | 0.0439005784 | 43 |
| 2029 | 0.074740734726 | 0.062283945605 | 0.03799320681905 | 63 |
| 2030 | 0.07947431459198 | 0.0685123401655 | 0.05755036573902 | 79 |
Comparative Analysis Report: Trust Wallet Token (TWT) vs The Graph (GRT)
I. Historical Price Comparison and Current Market Status
TWT and GRT Historical Price Trends
Trust Wallet Token (TWT):
- All-time high: $2.72 (December 12, 2022)
- All-time low: $0.00277641 (June 9, 2020)
- Historical decline: From peak to current price represents a 64.24% decrease from ATH
The Graph (GRT):
- All-time high: $2.84 (February 12, 2021)
- All-time low: $0.03741849 (December 16, 2025)
- Historical decline: From peak to current price represents a 98.68% decrease from ATH
Current Market Status (December 16, 2025)
Price Metrics:
- TWT current price: $0.9728
- GRT current price: $0.03819
- 24-hour trading volume: TWT $712,248.18 vs GRT $298,059.22
- Market sentiment index (Fear & Greed): 11 (Extreme Fear)
Market Capitalization:
- TWT market cap: $405,317,022.72 (Market rank: 144)
- GRT market cap: $405,901,540.24 (Market rank: 143)
- TWT fully diluted valuation: $972,800,000.00
- GRT fully diluted valuation: $412,462,036.94
II. Price Performance Analysis
Short-term Price Movements
| Time Period | TWT Change | GRT Change |
|---|---|---|
| 1 Hour | +0.33% | +0.53% |
| 24 Hours | -2.34% | -6.43% |
| 7 Days | -0.38% | -15.55% |
| 30 Days | -16.99% | -33.48% |
| 1 Year | -30.20% | -86.70% |
Analysis: GRT demonstrates significantly greater volatility and downward pressure across all timeframes. While TWT has declined 30.20% annually, GRT has experienced an 86.70% decline, indicating more severe bearish pressure on The Graph token.
Trading Activity
- TWT 24-hour high: $1.0151 / Low: $0.9424
- GRT 24-hour high: $0.04087 / Low: $0.03722
- TWT trading volume indicates higher market activity relative to its price level
- GRT's lower trading volume suggests reduced market engagement
III. Token Economics and Utility
Trust Wallet Token (TWT)
Use Cases:
- Governance: Participation in network decision-making processes, including addition of new blockchains, tokens, and product features
- Discount: In-app discounts for digital currency purchases and decentralized exchange services
Supply Metrics:
- Total supply: 1,000,000,000 TWT
- Circulating supply: 416,649,900 TWT (41.67%)
- Maximum supply: 999,860,531.46 TWT
- Token holders: 266,613
Network Support:
- Operates on BEP-2 and BEP-20 standards
- Primary deployment on BSC (Binance Smart Chain)
The Graph (GRT)
Use Cases:
- Indexer Staking: Indexers stake GRT tokens to participate in the query market and provide economic security during work execution
- Curator Signal: Curators stake GRT in the curator market to predict which subgraphs hold value for the network, earning rewards for correct predictions
Supply Metrics:
- Total supply: 10,800,262,816.04821 GRT
- Circulating supply: 10,628,477,094.52801 GRT (98.41%)
- Maximum supply: 10,800,262,823.32 GRT
- Token holders: 173,437
Network Support:
- Primary deployment: Ethereum (ETH)
- Secondary deployment: Arbitrum (ARBEVM)
- Utilizes settlement in GRT across the protocol for unified accounting
IV. Market Fundamentals Comparison
Project Overview
Trust Wallet:
- Digital currency wallet supporting 40 blockchain protocols
- Access to over 160,000 digital assets
- Staking support on Cosmos, Tezos, Kava, and other protocols
- Digital collectibles storage and accessibility features
The Graph:
- Decentralized protocol for indexing and querying blockchain data
- Applied to Ethereum ecosystem
- Enables open API (subgraph) construction for data accessibility
- Economic incentive structure through dynamic inflation policy
Market Distribution
TWT:
- Circulating ratio: 41.67% of total supply
- Market cap to FDV ratio: 41.67%
- Indicates significant supply yet to enter circulation
GRT:
- Circulating ratio: 98.41% of total supply
- Market cap to FDV ratio: 98.41%
- Nearly complete supply already in circulation
Exchange Presence
- TWT available on 31 exchanges
- GRT available on 62 exchanges
- GRT demonstrates broader market accessibility
V. Investment Strategy Comparison: TWT vs GRT
Long-term vs Short-term Investment Strategies
Trust Wallet Token (TWT):
- Suitable for investors focusing on wallet utility expansion and governance participation within multi-chain ecosystems
- Medium-term accumulation opportunity with lower volatility profile compared to GRT
- Better suited for risk-averse participants seeking exposure to digital asset management infrastructure
The Graph (GRT):
- Suitable for investors seeking exposure to decentralized data infrastructure and blockchain indexing protocols
- Higher risk-reward profile appropriate for investors with elevated volatility tolerance
- Targets participants interested in Ethereum ecosystem data access solutions and subgraph development
Risk Management and Asset Allocation
Conservative Investor Allocation:
- TWT: 70% vs GRT: 30%
- Rationale: TWT's lower annual decline (-30.20% vs -86.70%) and higher trading volume suggest relatively greater stability
Aggressive Investor Allocation:
- TWT: 40% vs GRT: 60%
- Rationale: GRT's extreme drawdown from ATH presents higher recovery potential in optimistic scenarios despite elevated volatility
Hedging Instruments:
- Stablecoin allocation (20-30% of portfolio) to reduce downside exposure in extreme fear conditions (current Fear & Greed Index: 11)
- Cross-asset diversification across multiple blockchain protocols supported by Trust Wallet infrastructure
- Consideration of dollar-cost averaging strategy given persistent bearish sentiment
VI. Price Forecast Analysis: 2025-2030
Short-term Outlook (2025)
TWT Projections:
- Conservative range: $0.82-$0.97
- Optimistic scenario: $1.32
GRT Projections:
- Conservative range: $0.02-$0.04
- Optimistic scenario: $0.043
Medium-term Forecast (2026-2028)
| Year | TWT High | TWT Low | GRT High | GRT Low |
|---|---|---|---|---|
| 2026 | $1.24 | $0.67 | $0.055 | $0.026 |
| 2027 | $1.24 | $1.11 | $0.062 | $0.030 |
| 2028 | $1.39 | $0.83 | $0.070 | $0.044 |
Key Drivers:
- Institutional capital inflows into institutional-grade custody solutions
- Spot ETF approvals for crypto asset exposure
- Ecosystem expansion and strategic partnership announcements
Long-term Forecast (2029-2030)
TWT Projections:
- Base case (2030): $1.17-$1.31
- Optimistic case (2030): $1.73-$1.85
- Cumulative return potential: 61% growth from current price
GRT Projections:
- Base case (2030): $0.038-$0.069
- Optimistic case (2030): $0.074-$0.079
- Cumulative return potential: 79% growth from current price (though from significantly lower baseline)
VII. Potential Risk Comparison
Market Risk
Trust Wallet Token (TWT):
- Wallet market consolidation risks from competing solutions (MetaMask, Ledger Live)
- Dependency on BSC and multi-chain ecosystem adoption rates
- 64.24% decline from ATH indicates past vulnerability to market cycles
The Graph (GRT):
- Severe 98.68% decline from ATH reflects substantial bearish pressure and potential protocol adoption challenges
- 86.70% annual decline suggests weak current market demand for data indexing services
- Ethereum-centric dependency creates ecosystem concentration risk
Technology Risk
Trust Wallet Token (TWT):
- Cross-chain bridge security and interoperability vulnerabilities
- Scalability challenges as supported asset count increases
- Third-party protocol integration risks on supported blockchains
The Graph (GRT):
- Indexer network decentralization challenges and potential data accuracy issues
- Subgraph query reliability under network stress conditions
- Arbitrum deployment adoption uncertainty
Regulatory Risk
- Both tokens face potential global regulatory restrictions on cryptocurrency asset trading and utility tokens
- Wallet functionality may encounter regulatory scrutiny regarding KYC/AML compliance requirements (for TWT)
- Data indexing and oracle functionality face evolving regulatory frameworks across jurisdictions
- Staking mechanisms and yield generation may encounter securities law considerations
VIII. Conclusion: Which Is the Better Buy?
📌 Investment Value Summary
Trust Wallet Token (TWT) Advantages:
- More moderate historical drawdown (-64.24% vs -98.68%)
- Higher trading volume and liquidity ($712,248 vs $298,059)
- Lower circulating supply ratio provides expansion potential
- More stable year-over-year performance (-30.20% vs -86.70%)
- Broader user adoption across wallet ecosystem
The Graph (GRT) Advantages:
- Higher long-term price appreciation potential: 79% projected growth (2030) vs 61% for TWT
- Broader exchange availability (62 exchanges vs 31)
- Decentralized infrastructure positioning aligns with protocol development trends
- Higher token holder count (173,437 vs 266,613 distributed across larger holder base)
- Potential recovery from extreme oversold conditions
✅ Investment Recommendations
Beginner Investors:
- Recommended strategy: Allocate 70% TWT and 30% GRT within a diversified portfolio context
- Rationale: TWT offers lower volatility and clearer utility proposition for wallet users
- Implementation: Dollar-cost averaging over 3-6 months during sustained extreme fear conditions (current index: 11)
Experienced Investors:
- Recommended strategy: Tactical allocation of 40% TWT and 60% GRT with active rebalancing
- Rationale: GRT's extreme valuation compression presents asymmetric risk-reward in medium-term timeframe
- Implementation: Establish position during extreme fear sentiment; set profit-taking targets at 30-50% recovery levels
Institutional Investors:
- Recommended strategy: Diversified approach across both assets with position sizing reflecting market cap parity (~50% each)
- Rationale: Similar current market capitalizations suggest comparable fundamental valuations despite different risk profiles
- Implementation: Structured entry through OTC markets; utilize options hedging for downside protection; monitor ecosystem developments for thesis validation
⚠️ Risk Disclaimer
Cryptocurrency markets demonstrate extreme volatility influenced by unpredictable factors including regulatory changes, macroeconomic conditions, and technological developments. Past price performance does not guarantee future results. This analysis presents historical data models and statistical projections for informational purposes only and does not constitute investment advice or recommendations to buy or sell any asset. Investors should conduct independent research and consult qualified financial advisors before making investment decisions. The extreme fear market sentiment (index value: 11) represents heightened risk conditions. All cryptocurrency investments carry substantial risk of partial or complete capital loss.
Report Date: December 16, 2025
Data Current As Of: December 16, 2025, 15:13:43 UTC
None
Frequently Asked Questions: TWT vs GRT Investment Comparison
I. FAQ
Q1: What are the key differences between TWT and GRT in terms of current market performance?
A: Trust Wallet Token (TWT) is currently trading at $0.9728 with a 64.24% decline from its all-time high of $2.72, while The Graph (GRT) is at $0.03819 with a severe 98.68% decline from its ATH of $2.84. In the past year alone, TWT declined 30.20% while GRT dropped 86.70%, indicating that GRT has experienced significantly greater bearish pressure. Both tokens maintain similar market capitalizations around $405 million, but TWT demonstrates higher trading volume ($712,248 vs $298,059), suggesting better market liquidity.
Q2: How do the token economics and utility mechanisms differ between TWT and GRT?
A: Trust Wallet Token (TWT) functions as a governance and utility token for the Trust Wallet ecosystem, offering governance rights over blockchain additions and in-app discounts for transactions. It has 416.6 million tokens in circulation (41.67% of total supply), creating significant room for supply expansion. The Graph (GRT) operates as a staking and incentive token where indexers and curators stake GRT to participate in the data indexing network and earn protocol rewards. GRT has 10.6 billion tokens in circulation (98.41% of total supply), meaning most tokens are already circulating with limited supply shock potential.
Q3: Which token has better long-term growth potential based on price forecasts?
A: GRT projects higher cumulative growth potential at 79% by 2030 (reaching $0.074-$0.079) compared to TWT's 61% projection ($1.73-$1.85 by 2030). However, these projections must be contextualized within risk profiles—GRT's higher upside reflects recovery potential from extreme oversold conditions, while TWT offers more stable, moderate growth. The forecast assumes continued institutional capital inflows, potential spot ETF approvals, and ecosystem expansion, none of which are guaranteed outcomes.
Q4: What is the current market sentiment, and how does it affect investment decisions for both tokens?
A: The current Fear & Greed Index reading of 11 indicates extreme fear in the cryptocurrency market as of December 16, 2025. This extreme sentiment creates both risks and opportunities—while it signals significant downside danger, it also suggests potential accumulation opportunities for long-term investors with sufficient risk tolerance. Both tokens are trading far below historical peaks in a depressed market environment, making it critical to employ risk management strategies such as dollar-cost averaging and position sizing rather than attempting to time the market.
Q5: Which token is more suitable for conservative versus aggressive investors?
A: Conservative investors should allocate approximately 70% to TWT and 30% to GRT, as TWT exhibits lower volatility (-30.20% annual decline), higher trading volume, and clearer utility as a wallet governance token with established user adoption. Aggressive investors may consider a 40% TWT and 60% GRT allocation to capitalize on GRT's higher recovery potential and asymmetric risk-reward profile, though this requires elevated volatility tolerance and longer investment horizons. All allocations should include 20-30% stablecoin reserves given the extreme fear sentiment.
Q6: What are the primary risks associated with investing in TWT versus GRT?
A: TWT faces wallet market consolidation risks from competitors like MetaMask, dependency on BSC adoption, and cross-chain bridge security vulnerabilities. GRT's primary risks include the extreme 98.68% ATH decline suggesting weak current adoption, Ethereum-centric ecosystem concentration, indexer network decentralization challenges, and data accuracy concerns. Both tokens face regulatory uncertainty regarding cryptocurrency trading restrictions, KYC/AML compliance for wallet functionality (TWT), and evolving securities law treatment of staking mechanisms. Neither token has demonstrated ability to recover to previous valuations within current market cycles.
Q7: How do exchange availability and liquidity compare between the two tokens?
A: The Graph (GRT) has significantly broader exchange accessibility with presence on 62 exchanges compared to TWT's 31 exchanges, providing greater trading optionality and market reach. However, TWT demonstrates superior trading volume relative to price levels ($712,248 daily vs $298,059), suggesting more concentrated but stronger liquidity. GRT's broader exchange availability may indicate more fragmented liquidity across platforms. For large position accumulation or liquidation, TWT's higher volume may offer better execution despite fewer exchange listings.
Q8: What investment strategy should I implement given the current extreme fear market sentiment?
A: Given the extreme fear conditions (Fear & Greed Index: 11), implement a systematic dollar-cost averaging strategy over 3-6 months rather than attempting lump-sum investment. Allocate positions conservatively (70% TWT / 30% GRT for risk-averse; 40% TWT / 60% GRT for experienced investors), maintain 20-30% in stablecoins as dry powder for potential further declines, and establish predetermined profit-taking targets at 30-50% recovery levels. Monitor ecosystem developments—particularly institutional capital inflows, potential spot ETF approvals, and major partnership announcements—that could validate underlying investment theses. Avoid making decisions based on short-term price movements; instead, focus on quarterly portfolio rebalancing and thesis validation.
Report Date: December 16, 2025
Data Currency: December 16, 2025, 15:13:43 UTC
Disclaimer: This analysis is provided for informational purposes only and does not constitute investment advice. Cryptocurrency investments carry substantial risk of capital loss. Conduct independent research and consult qualified financial advisors before making investment decisions.
Share
Content
Introduction: TWT vs GRT Investment Comparison
I. Historical Price Comparison and Current Market Status
II. Price Performance Analysis
III. Token Economics and Utility
IV. Market Fundamentals Comparison
V. Risk Considerations and Market Context
I. Executive Summary
II. Core Factors Influencing TWT vs GRT Investment Value
III. Investment Considerations
IV. Limitations of This Analysis
III. 2025-2030 Price Forecasts: TWT vs GRT
I. Historical Price Comparison and Current Market Status
II. Price Performance Analysis
III. Token Economics and Utility
IV. Market Fundamentals Comparison
V. Investment Strategy Comparison: TWT vs GRT
VI. Price Forecast Analysis: 2025-2030
VII. Potential Risk Comparison
VIII. Conclusion: Which Is the Better Buy?
I. FAQ
How to Buy Cryptocurrency


Trending Cryptocurrencies


XZXX: A Comprehensive Guide to the BRC-20 Meme Token in 2025

Bitcoin Fear and Greed Index: Market Sentiment Analysis for 2025

Top Crypto ETFs to Watch in 2025: Navigating the Digital Asset Boom

5 ways to get Bitcoin for free in 2025: Newbie Guide

Bitcoin Market Cap in 2025: Analysis and Trends for Investors
2025 Bitcoin Price Prediction: Trump's Tariffs' Impact on BTC

Is Undeads Games (UDS) a good investment?: A Comprehensive Analysis of Risk, Potential Returns, and Market Viability
Is BUILDon (B) a good investment?: A Comprehensive Analysis of Performance, Risks, and Future Prospects

Is Vision (VSN) a good investment?: A Comprehensive Analysis of Token Performance, Market Potential, and Risk Factors for 2024

Is Arweave (AR) a good investment?: A Comprehensive Analysis of Risks, Opportunities, and Market Potential in 2024

Is Sonic (S) a good investment?: A Comprehensive Analysis of Price Predictions and Market Potential in 2024