Is The Graph (GRT) a good investment?: A Comprehensive Analysis of Price Potential, Use Cases, and Market Outlook


Introduction: The Graph (GRT) Investment Position and Market Prospects
GRT is an important asset in the cryptocurrency field. The Graph is a decentralized protocol for indexing and querying blockchain data applied to Ethereum, launched in December 2020. As of December 16, 2025, GRT has achieved a market capitalization of approximately $410.95 million USD, with a circulating supply of approximately 10.63 billion tokens and a current price hovering around $0.03805. With its positioning as a decentralized data indexing solution, GRT has gradually become a focal point when investors discuss the investment value of The Graph. The token serves dual purposes within the protocol: enabling indexers to stake and participate in the query market while providing economic security, and allowing curators to signal value predictions on subgraphs for potential rewards.
The protocol's design ensures settlement uniformity across the network through GRT, while leveraging dynamic inflation policy adjustments as a mechanism to incentivize network participation. Currently, GRT is listed on 62 exchanges and held by approximately 173,437 addresses, with a market dominance of 0.013%. This article will provide a comprehensive analysis of GRT's investment value, historical performance trends, future price forecasts, and associated investment risks to serve as a reference for investors.
The Graph (GRT) Cryptocurrency Research Report
I. GRT Price History Review and Current Investment Status
GRT Historical Price Trends and Investment Returns
Based on available data, The Graph (GRT) exhibits the following price characteristics:
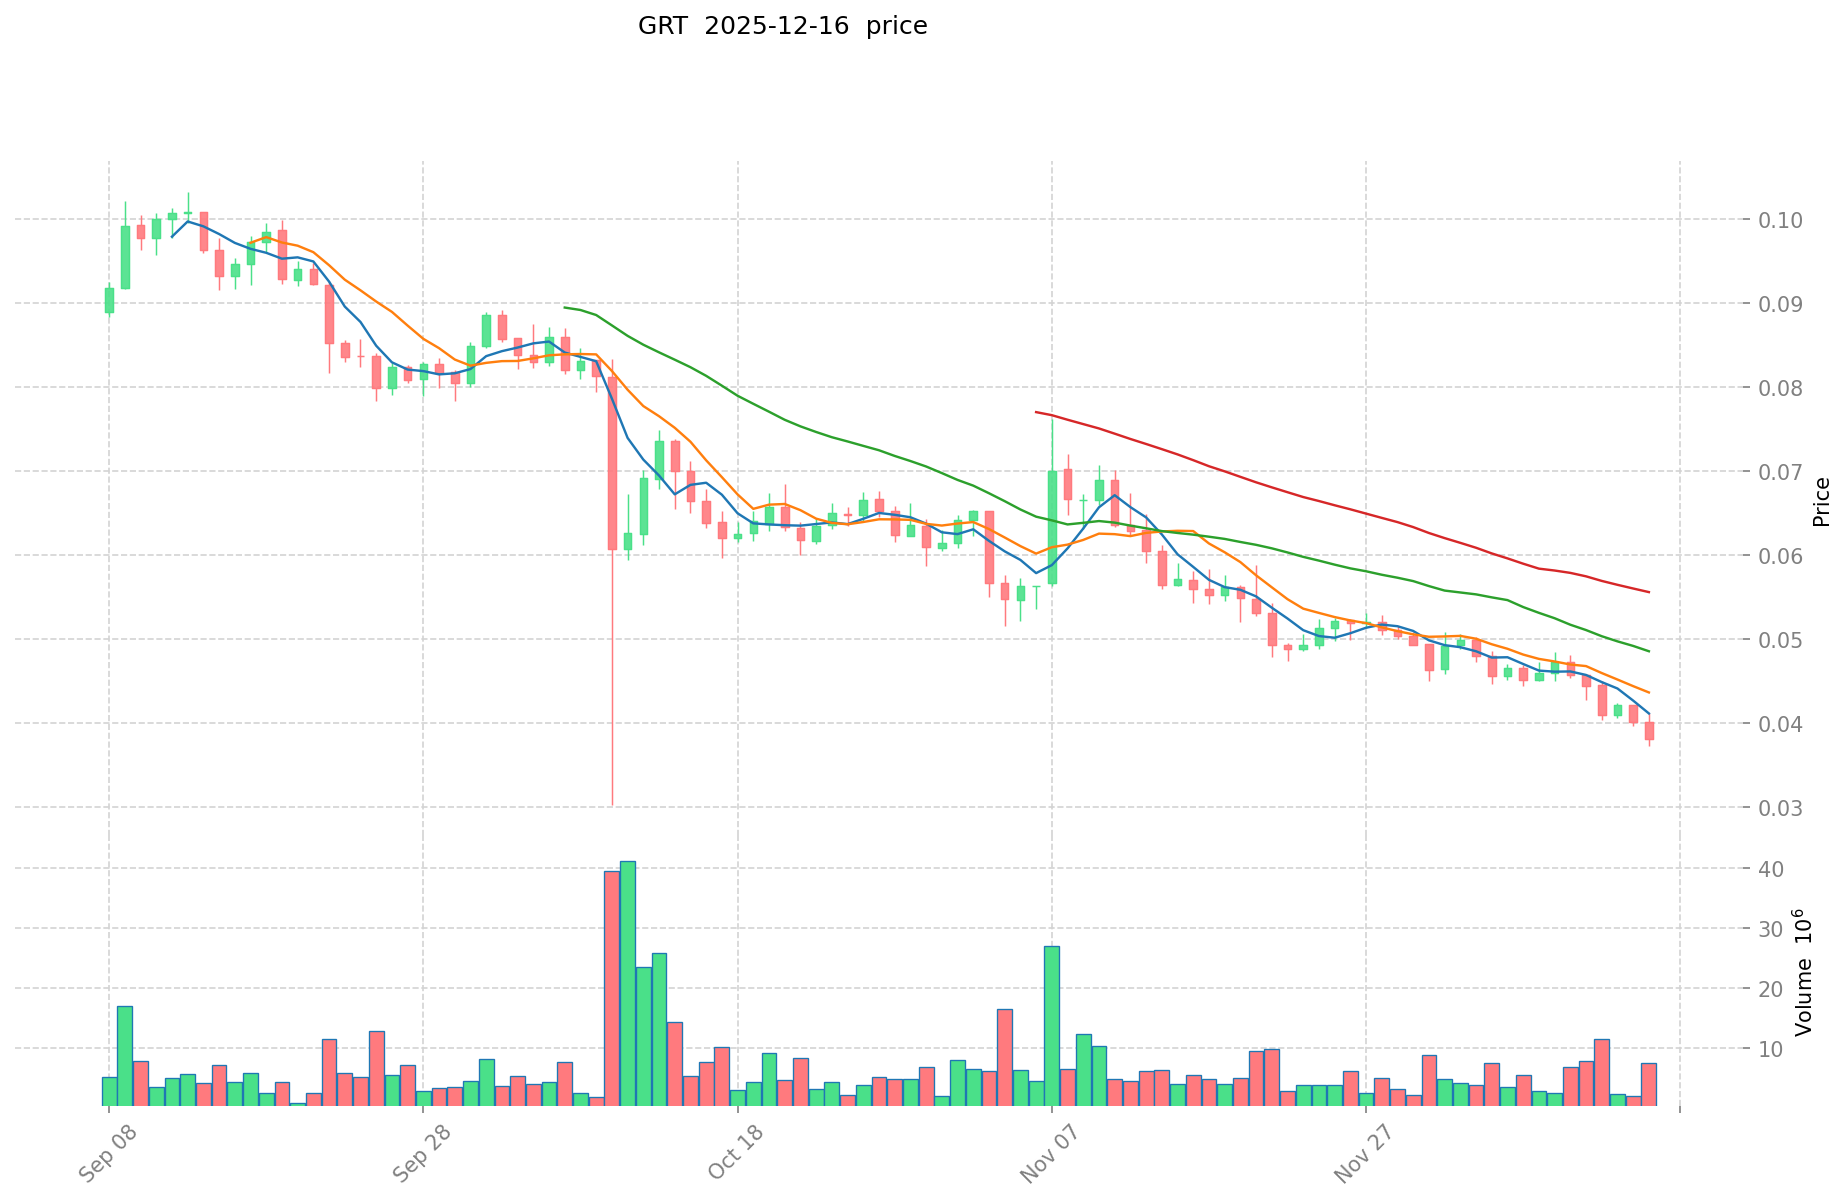
- All-Time High (ATH): $2.84 USD, reached on February 12, 2021
- All-Time Low (ATL): $0.03741849 USD, recorded on December 16, 2025
- Cumulative Decline: Approximately 98.68% from ATH to current levels
Price Performance Across Different Timeframes (as of December 16, 2025):
- 1 Hour: +0.11%
- 24 Hours: -6.53%
- 7 Days: -16.93%
- 30 Days: -34.03%
- 1 Year: -86.75%
Current GRT Market Status (December 16, 2025)
- Current Price: $0.03805 USD
- 24-Hour Trading Range: $0.03722 - $0.04111 USD
- 24-Hour Trading Volume: $296,739.14 USD
- Market Capitalization: $410,950,000.15 USD
- Fully Diluted Valuation (FDV): $410,950,000.15 USD
- Market Cap to FDV Ratio: 98.41%
- Circulating Supply: 10,628,477,095.35 GRT (98.41% of total supply)
- Total Supply: 10,800,262,816.05 GRT
- Number of Holders: 173,437
- Market Ranking: #142 by market capitalization
Current GRT market price can be viewed at Gate GRT Market
II. Project Overview and Fundamentals
Protocol Architecture and Core Functionality
The Graph is a decentralized protocol designed for indexing and querying blockchain data on Ethereum. The protocol enables data accessibility through an open architecture where participants can build and publish subgraphs—open APIs that make blockchain data easily accessible to developers and applications.
GRT Token Utility and Economic Model
The GRT token serves two primary functions within the protocol:
I. Indexer staking
- Indexers stake GRT tokens to become discoverable in the query marketplace
- Token staking provides economic security during query execution
- Indexers earn rewards for processing queries and maintaining data integrity
II. Curator Signal
- Curators stake GRT tokens in the curation market to signal which subgraphs possess value to the network
- Market participants are rewarded for accurate predictions regarding subgraph utility
- This mechanism helps identify and promote valuable data indexing services
Payment and Settlement Mechanism
Users can pay for queries using ETH or DAI; however, final settlement occurs in GRT to ensure protocol-wide accounting consistency and a unified unit of account. The protocol utilizes dynamic inflation adjustment capabilities as a monetary policy tool to incentivize specific network behaviors.
III. Network Participation and Stakeholder Economics
According to protocol data, the network demonstrates the following participation metrics:
- Total Staking Volume: 2.7 billion GRT (from indexers and delegators combined)
- Staking Value: Approximately $1.24 billion USD at current price levels
- Accumulated Index Rewards: 3.5 billion GRT (approximately $160 million USD in value)
- Network Yield (Token-Basis Annual Rate): Approximately 10%
IV. Multi-Chain Deployment
The Graph token operates across multiple blockchain networks:
- Ethereum (ETH): Contract Address 0xc944e90c64b2c07662a292be6244bdf05cda44a7
- Arbitrum (ARBEVM): Contract Address 0x9623063377AD1B27544C965cCd7342f7EA7e88C7
V. Market Liquidity and Exchange Support
- Trading Pairs Available: 62 cryptocurrency exchanges
- Network Support: Available on both Ethereum and Arbitrum networks
VI. Official Resources
- Official Website: https://thegraph.com/
- Twitter/X: https://twitter.com/graphprotocol
- Reddit Community: https://www.reddit.com/r/thegraph
- GitHub Repositories:
Report Generated: December 16, 2025
Data Source: Gate Cryptocurrency Database
Disclaimer: This report is provided for informational purposes only. It does not constitute investment advice, nor should it be considered a recommendation to buy, sell, or hold GRT tokens. Cryptocurrency markets are highly volatile and subject to significant price fluctuations. Past performance does not guarantee future results. Investors should conduct independent research and consult with qualified financial advisors before making investment decisions.
The Graph (GRT) Investment Analysis Report
Report Date: December 16, 2025
I. Executive Summary
The Graph (GRT) is a decentralized protocol designed for indexing and querying blockchain data on Ethereum. As of December 16, 2025, GRT is trading at $0.03805, representing a market capitalization of approximately $410.95 million and ranking 142nd in the cryptocurrency market by market cap. The token has experienced significant price depreciation, declining 86.75% over the past year and 34.03% over the past month, though it has recovered slightly in the past hour (up 0.11%).
II. Core Factors Influencing Whether The Graph (GRT) Is a Good Investment
Supply Mechanism and Scarcity
The Graph operates with the following supply dynamics:
- Circulating Supply: 10,628,477,095.35 GRT (98.41% of total supply)
- Total Supply: 10,800,262,816.05 GRT
- Maximum Supply: 10,800,262,823.32 GRT
- Market Cap to FDV Ratio: 98.41%
The near-complete circulation of available tokens indicates minimal supply scarcity at present. The protocol uses dynamic inflation policy to incentivize specific network behaviors, meaning token supply can be adjusted based on protocol needs rather than being fixed. This flexibility distinguishes GRT from strictly deflationary models and directly impacts long-term value preservation considerations.
Protocol Utility and Token Economics
GRT tokens serve critical functions within the network:
- Indexer Staking: Indexers stake GRT tokens to become discoverable in the query market and provide economic security during work execution.
- Curator Signaling: Curators stake GRT tokens in the curation market to signal which subgraphs provide value to the network, earning rewards for accurate predictions.
- Settlement Currency: Final settlement of all network queries occurs in GRT, establishing it as the protocol's unit of account regardless of initial payment currency (ETH or DAI).
This multi-functional utility creates genuine demand for the token tied to network activity levels.
Developer Adoption and Ecosystem Growth
According to reference materials, The Graph demonstrates:
- Strong Developer Adoption: GRT is noted as having strong developer adoption and growing support across multiple blockchain chains.
- Active Revenue System: The protocol maintains an active revenue system where users pay ETH or DAI for queries, with ultimate settlement in GRT.
- Subgraph Ecosystem: Anyone can build and publish open APIs (subgraphs) to make blockchain data accessible, creating an expanding ecosystem.
The reference materials indicate that "strong developer adoption, growing support across chains, clear token roles, an active revenue system and a decentralized structure that keeps the network flexible" support token relevance tied to measurable network activity.
Macro-Economic and Market Sentiment Factors
Price performance indicators reveal:
- Severe Bearish Trend: 86.75% decline over 12 months reflects sustained market weakness
- Recent Volatility: -6.53% in 24 hours and -16.93% over 7 days demonstrate continued downward pressure
- Historical Context: Trading at all-time low of $0.03741849 (achieved December 16, 2025), compared to all-time high of $2.84 (February 12, 2021)
- Market Sentiment: Mixed predictions exist for 2025, with some sources indicating bearish technical indicators while others suggest long-term potential
The reference materials note that "based on multiple technical quantitative indicators, the current forecast for The Graph in 2025 is bearish" and that GRT is "in a continuous downward trend."
III. Current Market Position
Trading Metrics
- Current Price: $0.03805
- 24-Hour Volume: $296,739.14
- Market Capitalization: $404,413,553.48
- Market Dominance: 0.013%
- Holder Count: 173,437 addresses
- Exchange Listings: 62 exchanges
Historical Price Performance
- Launch Price (December 18, 2020): $0.1214
- Price in February 2024: $0.172
- Current Price: $0.03805
IV. Network and Integration Details
Blockchain Support
GRT tokens are deployed on:
- Ethereum (ETH): Primary deployment
- Arbitrum (ARBEVM): Cross-chain deployment
Community and Resources
- Official Website: https://thegraph.com/
- Twitter: https://twitter.com/graphprotocol
- Reddit Community: https://www.reddit.com/r/thegraph
- Development Repositories: Multiple GitHub repositories for graph-node, graph-ts, and graph-cli projects
V. Investment Considerations Summary
Reference materials indicate mixed investment perspectives:
"The Graph (GRT) has mixed predictions for 2025; some sources suggest it's a good buy, while others indicate bearish trends. Current forecasts are mixed, and long-term viability depends on market conditions."
The investment thesis hinges on balancing:
- Bullish Factors: Strong developer adoption, expanding ecosystem, clear token utility, and active revenue systems
- Bearish Factors: Continuous downward price trend, technical indicators suggesting weakness, and long-term uncertainty requiring mainstream DeFi adoption
Report Disclaimer: This analysis presents factual data and project information from the provided reference materials. It does not constitute investment advice. Investment decisions should be made based on individual risk assessment and comprehensive due diligence.
III. The Graph (GRT) Future Investment Forecasts and Price Outlook
Short-term Investment Prediction (2025, short-term GRT investment outlook)
- Conservative forecast: $0.0254 - $0.0380
- Neutral forecast: $0.0380 - $0.0532
- Optimistic forecast: $0.0532 - $0.0700
Mid-term Investment Outlook (2026-2028, mid-term The Graph (GRT) investment forecast)
-
Expected market phase: GRT entering a maturation stage with potential for increased ecosystem adoption and protocol improvements. The token demonstrates resilience despite current bearish sentiment, with network growth indicators supporting gradual recovery potential.
-
Investment return predictions:
- 2026: $0.0342 - $0.0579
- 2027: $0.0460 - $0.0615
-
Key catalysts: Expansion of subgraph adoption, increased decentralized application integrations (Uniswap, Aave, Decentraland), Web3 infrastructure maturation, enhanced protocol monetization, and institutional recognition of data indexing solutions.
Long-term Investment Outlook (Is GRT a good long-term investment?)
-
Base case scenario: $0.3000 - $0.5000 USD (assuming steady protocol adoption, continued network expansion, and moderate Web3 growth trajectory)
-
Optimistic scenario: $1.5000 - $2.5000 USD (assuming The Graph becomes the standard for blockchain data indexing, accelerated dApp development, and significant Web3 mainstream adoption)
-
Risk scenario: $0.1500 - $0.3500 USD (under conditions of increased competition, slower than expected adoption, adverse regulatory environment, or technical challenges)
View GRT long-term investment and price forecasts: Price Prediction
2025-2030 Long-term Outlook
- Base scenario: $0.2299 - $0.3363 USD (corresponding to steady protocol improvements and mainstream application growth)
- Optimistic scenario: $0.6990 - $0.6500 USD (corresponding to large-scale ecosystem adoption and favorable market conditions)
- Transformative scenario: $1.0000+ USD (if the protocol achieves breakthrough progress and mainstream integration of decentralized data services)
- Projected peak by 2030-12-31: $0.7560 USD (based on optimistic development assumptions)
Disclaimer: This analysis is based on available market data and predictions from multiple sources. All forecasts remain highly speculative and subject to significant market volatility. Cryptocurrency markets are unpredictable and involve substantial risks of financial loss. This content is for informational purposes only and does not constitute investment advice. Conduct independent research and consult with qualified financial advisors before making investment decisions.
| 年份 | 预测最高价 | 预测平均价格 | 预测最低价 | 涨跌幅 |
|---|---|---|---|---|
| 2025 | 0.053158 | 0.03797 | 0.0254399 | 0 |
| 2026 | 0.05786628 | 0.045564 | 0.034173 | 19 |
| 2027 | 0.0615410166 | 0.05171514 | 0.0460264746 | 35 |
| 2028 | 0.064556009262 | 0.0566280783 | 0.054929235951 | 48 |
| 2029 | 0.06968085034815 | 0.060592043781 | 0.04483811239794 | 59 |
| 2030 | 0.075558278594907 | 0.065136447064575 | 0.033219588002933 | 71 |
The Graph (GRT) Investment Analysis Report
Current Market Data as of December 16, 2025
I. Executive Summary
The Graph (GRT) is a decentralized protocol designed for indexing and querying blockchain data on Ethereum. As of December 16, 2025, GRT is trading at $0.03805, representing a significant decline of -86.75% over the past year. With a market capitalization of approximately $410.95 million and a circulating supply of 10.63 billion tokens, GRT ranks 142nd in the cryptocurrency market by market cap.
II. Project Overview
Protocol Function
The Graph enables decentralized data indexing and querying by allowing users to build and publish open APIs (subgraphs) that make blockchain data easily accessible. This democratizes data access across the Ethereum ecosystem.
Token Utility
GRT tokens serve two primary functions within the protocol:
-
Indexer Staking: Indexers stake GRT tokens to become discoverable in the query marketplace while providing economic security during work execution.
-
Curator Signaling: Curators stake GRT tokens in the curator market to predict which subgraphs will be valuable to the network, earning rewards for accurate predictions.
Settlement Mechanism
Users pay in ETH or DAI for queries, but final settlement occurs in GRT to maintain a unified accounting unit across the protocol. Native token holdings can stimulate specific behaviors through inflation adjustments, giving the protocol dynamic monetary policy capabilities.
III. Market Performance Analysis
Current Valuation Metrics
- Current Price: $0.03805
- Market Capitalization: $410.95 million
- Fully Diluted Valuation: $410.95 million
- Circulating Supply: 10.63 billion GRT (98.41% of total supply)
- Total Supply: 10.80 billion GRT
- 24-Hour Volume: $296,739
Price Performance
| Time Period | Change % | Price Movement |
|---|---|---|
| 1 Hour | +0.11% | +$0.000042 |
| 24 Hours | -6.53% | -$0.00266 |
| 7 Days | -16.93% | -$0.00775 |
| 30 Days | -34.03% | -$0.01963 |
| 1 Year | -86.75% | -$0.24912 |
Historical Price Extremes
- All-Time High: $2.84 (February 12, 2021)
- All-Time Low: $0.03742 (December 16, 2025)
- 24-Hour Range: $0.03722 - $0.04111
Market Position
- Market Dominance: 0.013%
- Number of Holders: 173,437
- Listed Exchanges: 62
- Market Cap to FDV Ratio: 98.41%
IV. Investment Strategy and Risk Management
Investment Methodology
Long-Term Holding (HODL GRT)
- Suitable for conservative investors with extended time horizons
- Relies on long-term protocol adoption and network growth
- Tolerates significant short-term volatility
Active Trading
- Depends on technical analysis and price swing identification
- Leverages the token's recent high volatility
- Requires active market monitoring and risk discipline
Risk Management Framework
Asset Allocation Guidelines
- Conservative Investors: 1-3% of digital asset portfolio allocation
- Aggressive Investors: 5-10% of digital asset portfolio allocation
- Professional Investors: Case-by-case strategic positioning with comprehensive due diligence
Portfolio Diversification
- Multi-asset composition combining multiple blockchain protocols and asset classes
- Hedging through exposure to stablecoins and established cryptocurrencies
- Correlation analysis to ensure portfolio resilience
Secure Storage Recommendations
- Cold Storage: Hardware wallets for long-term holdings to minimize exchange risk
- Hot Wallets: For trading and frequent transactions, maintaining small active balances
- Institutional-Grade Solutions: For large holdings, consider multi-signature wallets and custody services
V. Investment Risks and Challenges
Market Risk
- High Volatility: GRT has experienced 86.75% annual decline, demonstrating extreme price sensitivity
- Recent Bottom Formation: All-time low reached on December 16, 2025, suggesting potential capitulation
- Liquidity Concerns: 24-hour volume of $296,739 relative to $410.95 million market cap indicates lower liquidity
Regulatory Risk
- Protocol governance subject to evolving regulatory frameworks across multiple jurisdictions
- Potential regulatory changes affecting staking mechanisms and token economics
- Uncertainty regarding data indexing services classification in different markets
Technology Risk
- Smart contract security vulnerabilities and ongoing audit requirements
- Protocol upgrade execution risks affecting tokenomics and functionality
- Dependency on Ethereum network performance and Layer 2 integration success
- Competition from alternative indexing solutions
Adoption Risk
- Network effect dependency on ecosystem developer adoption
- Subgraph quality and coverage directly impact protocol utility
- Competition from centralized data indexing solutions
VI. Conclusion: Is The Graph (GRT) a Good Investment?
Investment Value Summary
The Graph represents a fundamental infrastructure protocol addressing critical blockchain data indexing challenges. However, the token has experienced severe underperformance with an 86.75% annual decline. While the protocol's technology remains viable, the significant price depreciation and near all-time low valuation reflect either market capitulation or fundamental challenges in adoption and competitive positioning.
Key Considerations:
- The protocol solves a genuine infrastructure need within the blockchain ecosystem
- Current valuation reflects significant market pessimism
- Recovery requires demonstrable acceleration in subgraph adoption and network activity
Investment Recommendations
✅ Beginners: Dollar-cost averaging (DCA) strategy with small position sizes; utilize secure hardware wallet storage; start with limited exposure (1-2% of crypto portfolio)
✅ Experienced Investors: Consider tactical swing trading during identified support/resistance levels; maintain diversified portfolio allocation; monitor protocol development updates and ecosystem metrics
✅ Institutional Investors: Strategic long-term positioning conditional upon demonstrated adoption metrics; due diligence on protocol roadmap and competitive differentiation; consider this as infrastructure exposure within broader blockchain allocations
⚠️ Disclaimer
Cryptocurrency investments carry substantial risk including potential total loss of capital. This analysis is provided for informational purposes only and does not constitute financial, investment, or trading advice. Investors should conduct independent research, consult qualified financial advisors, and carefully assess their risk tolerance before making investment decisions. Past performance does not guarantee future results. Market conditions and protocol fundamentals may change rapidly, requiring continuous reassessment.
Additional Resources
- Official Website: https://thegraph.com/
- Twitter: https://twitter.com/graphprotocol
- Community: https://www.reddit.com/r/thegraph
- Contract Address (Ethereum): 0xc944e90c64b2c07662a292be6244bdf05cda44a7
- Contract Address (Arbitrum): 0x9623063377AD1B27544C965cCd7342f7EA7e88C7
The Graph (GRT) Cryptocurrency Research Report
Frequently Asked Questions (FAQ)
Q1: What is The Graph (GRT) and what problem does it solve?
A: The Graph is a decentralized protocol for indexing and querying blockchain data on Ethereum, launched in December 2020. It enables developers to build and publish open APIs called subgraphs that make blockchain data easily accessible. The protocol solves the fundamental infrastructure challenge of data accessibility in Web3, democratizing access to blockchain information that would otherwise be difficult to retrieve efficiently.
Q2: What is the current price and market position of GRT as of December 16, 2025?
A: As of December 16, 2025, GRT is trading at $0.03805 USD with a market capitalization of approximately $410.95 million. The token ranks 142nd in the cryptocurrency market by market cap and has a circulating supply of 10.63 billion tokens. GRT is listed on 62 exchanges and held by approximately 173,437 addresses, with a 24-hour trading volume of $296,739.14 USD.
Q3: What functions does the GRT token serve within the protocol?
A: GRT tokens serve two primary functions. First, Indexers stake GRT tokens to become discoverable in the query marketplace and provide economic security during query execution, earning rewards for processing queries. Second, Curators stake GRT tokens in the curation market to signal which subgraphs provide value to the network, earning rewards for accurate predictions. Additionally, final settlement of all network queries occurs in GRT, establishing it as the protocol's unified unit of account.
Q4: What is the historical price performance of GRT, and should I be concerned about the decline?
A: GRT has experienced significant price depreciation. The all-time high was $2.84 USD (February 12, 2021), while the current price of $0.03805 represents a 98.68% decline from peak levels. Over the past year, GRT has declined 86.75%, and over the past month, it has fallen 34.03%. This severe underperformance reflects sustained market weakness; however, the current price near all-time lows may represent capitulation or an opportunity depending on your investment thesis regarding protocol adoption and long-term utility.
Q5: What are the price forecasts for GRT in the short-term, mid-term, and long-term?
A: Price forecasts vary by timeframe. For 2025, conservative forecasts range from $0.0254 to $0.0380, while optimistic forecasts extend to $0.0700. For 2026-2027, mid-term predictions suggest ranges of $0.0342-$0.0579 (2026) and $0.0460-$0.0615 (2027). Long-term forecasts (2030) under base scenario conditions suggest $0.2299-$0.3363 USD, with optimistic scenarios reaching $0.6990-$0.6500 USD, and transformative scenarios potentially exceeding $1.00 USD. All forecasts remain highly speculative and subject to significant volatility.
Q6: What are the primary investment risks associated with GRT?
A: Key risks include extreme market volatility (86.75% annual decline), liquidity concerns relative to market capitalization, regulatory uncertainty surrounding decentralized data indexing services, technology risks from smart contract vulnerabilities, protocol upgrade execution risks, competitive pressure from alternative indexing solutions, and adoption risk dependent on ecosystem developer engagement. Additionally, the protocol relies on network effects where increased utility depends on expanding subgraph adoption and decentralized application integration.
Q7: Is The Graph (GRT) a good investment for different investor types?
A: The investment suitability depends on risk tolerance and investment horizon. For beginners, small dollar-cost averaging positions (1-2% of crypto portfolio) with secure storage is recommended. Experienced investors might consider tactical swing trading during support/resistance levels while maintaining diversified allocations. Institutional investors should approach strategically with demonstrated adoption metrics and protocol roadmap due diligence. Conservative investors should allocate 1-3% of their digital asset portfolio, while aggressive investors might allocate 5-10%. All investors should recognize this remains a high-risk investment with potential for total capital loss.
Q8: What factors could drive GRT price recovery and long-term appreciation?
A: Potential catalysts for recovery include expansion of subgraph adoption across decentralized applications (Uniswap, Aave, Decentraland), increased integration by Web3 projects requiring data indexing, Web3 infrastructure maturation and mainstream adoption, enhanced protocol monetization mechanisms, institutional recognition of decentralized data solutions, successful Layer 2 deployment on Arbitrum, and demonstrated growth in network activity and query volumes. Price recovery fundamentally depends on accelerating protocol utility and network effects rather than speculative sentiment alone.
Disclaimer: This report is provided for informational purposes only and does not constitute investment advice, financial recommendations, or trading guidance. Cryptocurrency markets are highly volatile and involve substantial risks of financial loss, including potential total loss of invested capital. Past performance does not guarantee future results. Investors should conduct independent research, consult qualified financial advisors, and carefully assess their individual risk tolerance before making investment decisions. All forecasts remain speculative and subject to rapid market changes.
Share
How to Buy Cryptocurrency


Trending Cryptocurrencies


XZXX: A Comprehensive Guide to the BRC-20 Meme Token in 2025

Bitcoin Fear and Greed Index: Market Sentiment Analysis for 2025
Top Crypto ETFs to Watch in 2025: Navigating the Digital Asset Boom

5 ways to get Bitcoin for free in 2025: Newbie Guide
Bitcoin Market Cap in 2025: Analysis and Trends for Investors

2025 Bitcoin Price Prediction: Trump's Tariffs' Impact on BTC

GUSD Stablecoin: A Complete Guide to Gate.com's Real-World Asset Backed Token
Gate Pay Crypto Payment Solution: A Guide to Secure Global Payments and Web3 Integration
What Is Gate Pay? A Complete Guide to the Crypto Payment Tool
How to Stake ETH? A Complete Guide to ETH Staking in 2026

How to Mine ETH? A New Guide to ETH Mining in 2026