DBR vs MANA: A Comprehensive Comparison of Two Leading Blockchain Gaming Tokens

Introduction: DBR vs MANA Investment Comparison
In the cryptocurrency market, the comparison between deBridge and Decentraland has always been a topic that investors cannot avoid. The two differ significantly in market capitalization ranking, application scenarios, and price performance, representing different positioning in the crypto asset landscape. deBridge (DBR): Since its launch in October 2024, it has gained market recognition by leveraging its positioning as DeFi's internet of liquidity, enabling real-time movement of assets and information across the DeFi landscape without the bottlenecks and risks of liquidity pools. Decentraland (MANA): Since its inception in 2017, it has been recognized as a blockchain-based virtual world platform, pioneering the metaverse space by allowing users to permanently own and operate virtual property rights without intermediary fees. This article will comprehensively analyze the investment value comparison between DBR and MANA from multiple dimensions including historical price trends, supply mechanisms, market positioning, and ecosystem development, while attempting to answer the question that investors care most about:
"Which is the better buy right now?"
Comparative Analysis Report: deBridge (DBR) and Decentraland (MANA)
I. Price History Comparison and Market Status
Historical Price Trends of DBR and MANA
deBridge (DBR):
- All-time high: $0.05764 (December 22, 2024)
- All-time low: $0.005 (October 17, 2024)
- Price decline from ATH to current: approximately 64.9%
Decentraland (MANA):
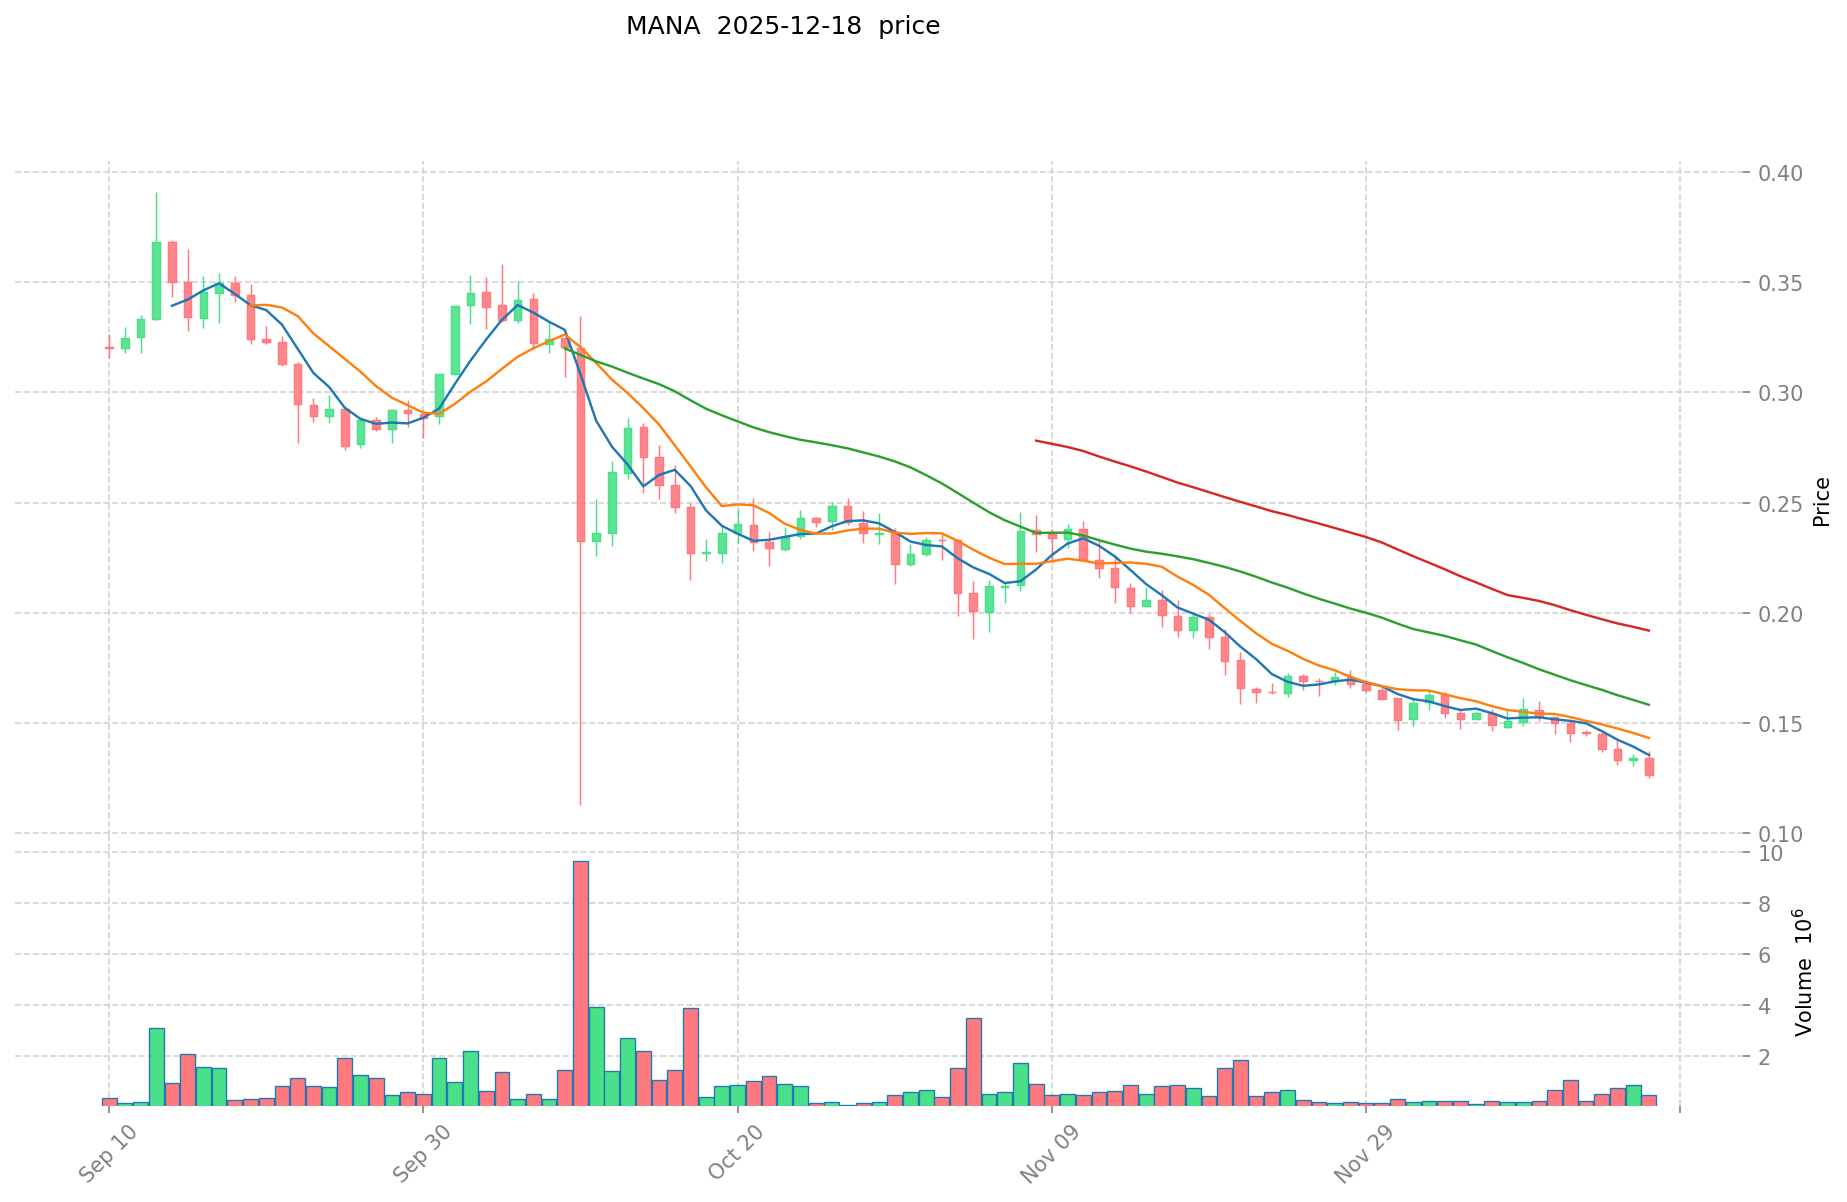
- All-time high: $5.85 (November 25, 2021)
- All-time low: $0.00923681 (October 31, 2017)
- Price decline from ATH to current: approximately 97.9%
Comparative Analysis: DBR has experienced a shorter price history since its October 2024 launch. In its initial trading period, DBR declined 64.9% from its December 2024 peak. MANA demonstrates a significantly longer market cycle dating back to 2017, with a dramatic 97.9% decline from its November 2021 peak, reflecting the challenges faced by metaverse-focused assets since the broader market downturn in 2022.
Current Market Status (December 19, 2025)
deBridge (DBR):
- Current price: $0.0202
- Market capitalization: $202,000,000
- Circulating supply: 1,800,000,000 DBR
- Total supply: 10,000,000,000 DBR
- 24-hour trading volume: $42,560.55
- Market ranking: #603
Decentraland (MANA):
- Current price: $0.1234
- Market capitalization: $270,638,328.99
- Circulating supply: 1,919,116,825.32 MANA
- Total supply: 2,193,179,327.32 MANA
- 24-hour trading volume: $136,810.92
- Market ranking: #197
Trading Volume Comparison: MANA maintains 3.2x higher 24-hour trading volume compared to DBR, indicating greater market liquidity and trading interest despite lower price performance.
Market Sentiment Index (Fear & Greed Index):
- Current index: 17
- Sentiment status: Extreme Fear
- Interpretation: The index indicates investors are experiencing extreme fear in the cryptocurrency market, suggesting pessimistic sentiment and potential risk aversion across crypto assets.
View Real-Time Prices:
- deBridge (DBR) current price: Market Price
- Decentraland (MANA) current price: Market Price
II. Price Movement Analysis
Short-Term Price Performance
deBridge (DBR) - Recent 12-Month Period:
- 1-hour change: -0.15%
- 24-hour change: +0.24%
- 7-day change: -9.54%
- 30-day change: -14.52%
- 1-year change: -41.42%
Decentraland (MANA) - Recent 12-Month Period:
- 1-hour change: -0.24%
- 24-hour change: -2.46%
- 7-day change: -17.73%
- 30-day change: -38.1%
- 1-year change: -78.59%
Analysis: Both assets demonstrate downward pressure over extended timeframes. MANA exhibits more pronounced negative performance across all measured periods, particularly over the 30-day and 1-year horizons. DBR's relatively recent market entry limits long-term comparison, but its year-to-date decline of 41.42% remains significant. The extreme fear sentiment reflects broader market conditions affecting both tokens.
III. Project Overview and Functionality
deBridge (DBR)
deBridge functions as DeFi's liquidity internet, enabling real-time movement of assets and information across the DeFi landscape. The protocol operates without the bottlenecks and risks associated with traditional liquidity pools, providing deep liquidity, tight spreads, and guaranteed rates to support cross-chain interactions.
Key Specifications:
- Blockchain: Solana (SOL)
- Token standard: SPL20
- Contract address: DBRiDgJAMsM95moTzJs7M9LnkGErpbv9v6CUR1DXnUu5
- Total holders: 91,422
- Listed on: 26 exchanges
Decentraland (MANA)
Decentraland is a blockchain-based virtual world platform where users can own, develop, and trade virtual land represented as non-fungible tokens (NFTs). MANA serves as the platform's native cryptocurrency and primary medium of exchange for land acquisition, in-game items, and virtual services.
Key Specifications:
- Blockchain: Ethereum (ETH)
- Token standard: ERC-20
- Contract address: 0x0F5D2fB29fb7d3CFeE444a200298f468908cC942
- Total holders: 287,876
- Listed on: 65 exchanges
IV. Tokenomics and Supply Dynamics
deBridge (DBR) Tokenomics
- Maximum supply: 10,000,000,000 DBR
- Circulating supply: 1,800,000,000 DBR (18% of total)
- Circulating ratio: 18%
- Fully diluted valuation: $202,000,000
- Publishing price: $0.03
Decentraland (MANA) Tokenomics
- Maximum supply: Unlimited (∞)
- Circulating supply: 1,919,116,825.32 MANA (87.5% of current total supply)
- Circulating ratio: 87.5%
- Fully diluted valuation: $270,638,328.99
- Publishing price: $0.02339
Comparative Analysis: DBR operates under a defined maximum supply model with significant inflation potential (82% of tokens remain unminted), while MANA functions with unlimited supply. MANA's higher circulation ratio (87.5% vs 18%) indicates greater token distribution, though its unlimited supply cap presents different long-term dynamics compared to DBR's capped model.
V. Market Position and Liquidity
deBridge (DBR):
- Market dominance: 0.0065%
- Exchange listings: 26
- Daily volume-to-market-cap ratio: 0.021% (lower liquidity indicator)
Decentraland (MANA):
- Market dominance: 0.0088%
- Exchange listings: 65
- Daily volume-to-market-cap ratio: 0.051% (higher liquidity indicator)
MANA benefits from significantly broader exchange distribution and higher trading volume relative to market capitalization, suggesting more liquid trading conditions. DBR's limited exchange presence and lower trading volume indicate emerging liquidity development.
VI. Risk Considerations
Market Risk Factors: Both assets operate in the extreme fear sentiment environment, indicating heightened market uncertainty and potential for continued downward pressure. MANA's 78.59% annual decline reflects sustained underperformance in the metaverse sector. DBR's shorter trading history limits long-term trend assessment but demonstrates 41.42% annual decline despite recent market emergence.
Liquidity and Volatility: The significant differences in trading volume and exchange listings create distinct liquidity profiles, with MANA offering greater trading accessibility and DBR presenting higher slippage risks during large transactions.
Report Generated: December 19, 2025
Data Sources: Gate, CoinMarketCap, Fear & Greed Index

Investment Value Analysis Report: DBR vs MANA
Executive Summary
Based on the available reference materials, this report evaluates the investment value of DBR and MANA tokens. The core investment value factors center on team background, technological innovation, community activity, and market demand. Key metrics include liquidity and market perception, with price fluctuations driven by supply and demand dynamics.
I. Core Investment Value Factors
Team Background and Project Foundation
- Critical Assessment Criteria: Strong team backgrounds, solid technical foundations, active community engagement, transparency, and realistic valuations are essential indicators for identifying promising tokens in saturated markets.
- Risk Considerations: Inherent risks require thorough research and due diligence before making investment decisions.
Market Perception Indicators
- Liquidity Assessment: Liquidity levels serve as key indicators for evaluating token viability and trading accessibility.
- Community Activity: Active community participation reflects project sustainability and investor confidence.
- Valuation Realism: Market perception heavily influences price movements independent of fundamental metrics.
II. Factors Affecting DBR vs MANA Investment Value
Market Fundamentals
- Supply and Demand Dynamics: Price fluctuations are fundamentally driven by supply and demand interactions within the market.
- Liquidity Factors: Relative liquidity between the two tokens affects their trading efficiency and price discovery mechanisms.
- Market Saturation Context: Both tokens operate within highly saturated cryptocurrency markets, requiring differentiation through distinctive value propositions.
Research Requirements
- Due Diligence Framework: Investors must conduct comprehensive analysis of both tokens' technical specifications, community strength, and market positioning.
- Risk Assessment: Fixed supply considerations, community engagement metrics, and transparency levels require careful evaluation.
- Long-term Sustainability: Valuation sustainability depends on real-world utility adoption and ecosystem development.
III. Investment Considerations
Market participants should recognize that identifying promising tokens in saturated markets requires systematic evaluation across multiple dimensions rather than reliance on single indicators.
Key Evaluation Parameters
- Team credibility and technical competence
- Community size and engagement quality
- Transparency in operations and communications
- Realistic market valuation relative to utility and adoption
- Liquidity depth and trading volume
IV. Disclaimer
This analysis is based on limited reference materials and represents a general framework for token evaluation. The information provided does not constitute investment advice, financial recommendation, or endorsement of either token. Cryptocurrency investments carry substantial risk, and investors should conduct independent research and consult with qualified financial advisors before making investment decisions.
III. 2025-2030 Price Forecast: DBR vs MANA
Short-term Forecast (2025)
- DBR: Conservative $0.011099 - $0.02018 | Optimistic $0.0258304
- MANA: Conservative $0.115808 - $0.1232 | Optimistic $0.13552
Mid-term Forecast (2027-2028)
- DBR may enter consolidation phase with price range $0.0231719877 - $0.036311867784, showing moderate growth trajectory
- MANA may enter recovery phase with price range $0.117821088 - $0.18219424608, demonstrating stronger upside potential
- Key drivers: institutional capital inflow, ETF approvals, ecosystem development, and market sentiment stabilization
Long-term Forecast (2030)
- DBR: Base case $0.041249496681158 - $0.04296822570954 | Optimistic case $0.062733609535928
- MANA: Base case $0.117323984763216 - $0.1862285472432 | Optimistic case $0.277480535392368
Disclaimer: This analysis is based on predictive modeling and historical data. Price forecasts are subject to significant market volatility and unforeseen factors. Past performance does not guarantee future results. Investors should conduct independent research and consult with financial advisors before making investment decisions.
DBR:
| 年份 | 预测最高价 | 预测平均价格 | 预测最低价 | 涨跌幅 |
|---|---|---|---|---|
| 2025 | 0.0258304 | 0.02018 | 0.011099 | 0 |
| 2026 | 0.031517124 | 0.0230052 | 0.019784472 | 13 |
| 2027 | 0.0381656268 | 0.027261162 | 0.0231719877 | 34 |
| 2028 | 0.036311867784 | 0.0327133944 | 0.019955170584 | 61 |
| 2029 | 0.05142382032708 | 0.034512631092 | 0.02105270496612 | 70 |
| 2030 | 0.062733609535928 | 0.04296822570954 | 0.041249496681158 | 112 |
MANA:
| 年份 | 预测最高价 | 预测平均价格 | 预测最低价 | 涨跌幅 |
|---|---|---|---|---|
| 2025 | 0.13552 | 0.1232 | 0.115808 | 0 |
| 2026 | 0.1384152 | 0.12936 | 0.0983136 | 4 |
| 2027 | 0.191459268 | 0.1338876 | 0.117821088 | 8 |
| 2028 | 0.18219424608 | 0.162673434 | 0.0894703887 | 31 |
| 2029 | 0.2000232544464 | 0.17243384004 | 0.1431200872332 | 39 |
| 2030 | 0.277480535392368 | 0.1862285472432 | 0.117323984763216 | 50 |
Comparative Investment Analysis Report: DBR vs MANA
I. Investment Strategy Comparison: DBR vs MANA
Long-term vs Short-term Investment Strategies
deBridge (DBR): Suitable for investors focused on DeFi infrastructure development and liquidity solutions. DBR's recent market entry (October 2024) appeals to early-stage adopters seeking exposure to emerging cross-chain liquidity protocols. Long-term positioning targets investors believing in DeFi ecosystem expansion and the increasing need for seamless asset movement across multiple blockchain networks.
Decentraland (MANA): Suitable for investors seeking recovery positions in established metaverse ecosystems. With roots dating to 2017, MANA appeals to long-term believers in virtual world adoption and virtual property ownership models. Short-term traders may view current depressed valuations as potential recovery opportunities following the 2021-2022 metaverse market correction.
Risk Management and Asset Allocation
Conservative Investors:
- DBR: 15% | MANA: 10%
- Rationale: Limited exposure to both high-volatility assets, with slight preference for MANA's established trading infrastructure (65 exchange listings vs DBR's 26)
- Complementary allocation: 75% stable coins or lower-volatility assets
Aggressive Investors:
- DBR: 35% | MANA: 25%
- Rationale: Higher DBR allocation reflects greater upside potential from emerging protocol adoption; MANA allocation targets recovery play from extreme valuations
- Complementary allocation: Derivatives strategies, cross-margin positions, or leveraged trades
Hedging Instruments:
- Stable coin reserves (USDC/USDT): 20-30% of portfolio for volatility mitigation
- Options strategies: Put options on both assets during extreme fear sentiment periods
- Cross-asset diversification: Combine with DeFi governance tokens (for DBR exposure) and established blue-chip cryptocurrencies (Bitcoin, Ethereum)
II. Potential Risk Comparison
Market Risks
deBridge (DBR):
- Extreme recent price volatility: 64.9% decline from December 2024 ATH indicates substantial draw-down risk for new entrants
- Liquidity constraints: Daily volume-to-market-cap ratio of 0.021% reflects limited trading depth, creating slippage risks during large transactions
- Market concentration: Only 1.8 billion tokens circulating from 10 billion total supply (18%) presents significant dilution risk as remaining 8.2 billion tokens enter circulation
- First-mover uncertainty: Limited operational history since October 2024 launch restricts long-term performance validation
Decentraland (MANA):
- Severe underperformance: 97.9% decline from November 2021 peak reflects sustained market skepticism toward metaverse sector
- Extended bear market exposure: 78.59% annual decline demonstrates persistent negative sentiment specifically targeting virtual world platforms
- Sector-specific headwinds: Metaverse adoption delays and reduced enterprise investment in virtual properties continue creating downward pressure
- Supply uncertainty: Unlimited maximum supply cap presents perpetual inflationary pressure without fixed scarcity mechanics
Technology Risks
deBridge (DBR):
- Cross-chain protocol vulnerability: Real-time asset movement across multiple blockchains introduces smart contract risk and potential bridge failure scenarios
- Solana blockchain dependency: Protocol's operation on Solana (SOL) creates network-specific risks including validator concentration and potential network outages
- Limited operational testing: Recent launch restricts the ability to assess protocol behavior during extreme market conditions or network congestion
Decentraland (MANA):
- Ethereum scaling limitations: Historical congestion periods have impacted transaction throughput and increased gas costs for virtual property transactions
- Virtual economy sustainability: Long-term viability depends on continuous user engagement and sustained demand for virtual property ownership
- NFT market correlation: MANA value closely follows broader NFT market sentiment, creating indirect exposure to cryptocurrency market cycles
Regulatory Risks
Global Regulatory Impacts: Both assets face evolving cryptocurrency regulatory frameworks across major jurisdictions:
- United States: SEC oversight of token classification affects both DeFi-focused (DBR) and virtual world (MANA) tokens. Potential classification as securities could impact trading venues and investor eligibility.
- European Union: MiCA (Markets in Crypto-Assets) regulation disproportionately affects newer protocols like DBR through compliance requirements. MANA benefits from longer regulatory history.
- Asia-Pacific: Variable regulatory approaches in Singapore, Hong Kong, and other regional hubs create differentiated risk profiles, with Singapore's positive DeFi stance potentially favoring DBR.
- Metaverse-specific regulation: MANA faces additional scrutiny from child safety and virtual commerce regulations as metaverse platforms evolve.
III. Conclusion: Which Is the Better Buy?
📌 Investment Value Summary
DBR Advantages:
- Emerging DeFi infrastructure positioning addresses critical liquidity fragmentation problem across blockchain networks
- Lower token circulation ratio (18%) provides potential upside from ecosystem adoption preceding full supply dilution
- Strong market demand for cross-chain solutions evidenced by rapid exchange expansion to 26 platforms within 2.5 months
- Price forecast through 2030 suggests potential 112% appreciation under base case scenario, with optimistic case reaching 210%
MANA Advantages:
- Established platform with 287,876 total holders and proven ecosystem development since 2017
- Higher trading liquidity (3.2x greater daily volume, 65 exchange listings) provides better trading accessibility and lower transaction friction
- Depressed valuation (97.9% below ATH) creates recovery potential if metaverse adoption accelerates
- Price forecast through 2030 suggests potential 50% appreciation under base case, with optimistic case reaching 125%
✅ Investment Recommendations
Beginner Investors: Recommend MANA as primary entry point due to:
- Superior liquidity infrastructure reducing execution slippage
- Longer operational history providing more comprehensive performance data
- Established ecosystem reducing uncertainty regarding project viability
- Allocation: 5-10% portfolio maximum, held within diversified cryptocurrency basket weighted toward established assets (Bitcoin, Ethereum)
Experienced Investors: Consider portfolio approach combining both tokens:
- DBR allocation (20-30%): Target early-stage DeFi infrastructure growth, appropriate for investors capable of assessing smart contract risks and cross-chain protocol functionality
- MANA allocation (15-25%): Implement as sector recovery play with defined stop-loss parameters (e.g., -30% from entry)
- Active monitoring required for both positions given current extreme fear sentiment (17 on Fear & Greed Index) and potential for sustained downward pressure
Institutional Investors: Recommend multi-phase accumulation strategy:
- Phase 1 (Weeks 1-4): Establish 30% target MANA position via limit orders at psychological support levels, leveraging superior liquidity for institutional-scale positions
- Phase 2 (Months 2-3): Initiate DBR position (20% of total allocation) through private placement opportunities or OTC desk transactions to minimize market impact
- Phase 3 (Ongoing): Maintain stable coin reserves (50%) for opportunistic additions during extreme fear periods; implement quarterly rebalancing protocols
IV. Price Forecast Summary (2025-2030)
deBridge (DBR) Trajectory
| Year | High Forecast | Average Forecast | Low Forecast | Change |
|---|---|---|---|---|
| 2025 | $0.0258 | $0.0202 | $0.0111 | 0% |
| 2026 | $0.0315 | $0.0230 | $0.0198 | 13% |
| 2027 | $0.0382 | $0.0273 | $0.0232 | 34% |
| 2028 | $0.0363 | $0.0327 | $0.0200 | 61% |
| 2029 | $0.0514 | $0.0345 | $0.0211 | 70% |
| 2030 | $0.0627 | $0.0430 | $0.0412 | 112% |
Decentraland (MANA) Trajectory
| Year | High Forecast | Average Forecast | Low Forecast | Change |
|---|---|---|---|---|
| 2025 | $0.1355 | $0.1232 | $0.1158 | 0% |
| 2026 | $0.1384 | $0.1294 | $0.0983 | 4% |
| 2027 | $0.1915 | $0.1339 | $0.1178 | 8% |
| 2028 | $0.1822 | $0.1627 | $0.0895 | 31% |
| 2029 | $0.2000 | $0.1724 | $0.1431 | 39% |
| 2030 | $0.2775 | $0.1862 | $0.1173 | 50% |
V. Final Assessment
The choice between DBR and MANA depends on investment thesis and risk tolerance:
- DBR represents emerging infrastructure play within DeFi sector, appropriate for growth-oriented investors capable of tolerating early-stage protocol risks and substantial liquidity constraints.
- MANA represents recovery/turnaround opportunity within established ecosystem, suitable for value-oriented investors seeking improved liquidity characteristics and lower technical complexity.
⚠️ Risk Disclaimer: This analysis is based on available reference materials and predictive modeling incorporating historical data through December 19, 2025. Cryptocurrency markets demonstrate extreme volatility and are subject to unpredictable regulatory changes, technological disruptions, and macroeconomic shifts. Price forecasts represent probabilistic scenarios, not guarantees. Past performance does not indicate future results. This report does not constitute investment advice, financial recommendation, or endorsement of either asset. Investors must conduct independent research and consult qualified financial advisors before making investment decisions. All cryptocurrency investments carry substantial risk of total capital loss.
Report Generated: December 19, 2025
Data Sources: Gate, CoinMarketCap, Fear & Greed Index
None
FAQ: deBridge (DBR) vs Decentraland (MANA) Investment Comparison
I. Basic Token Information
Q1: What are the key differences between DBR and MANA in terms of project positioning?
A: deBridge (DBR) functions as DeFi's liquidity internet, enabling real-time movement of assets and information across blockchain networks without traditional liquidity pool bottlenecks. Decentraland (MANA) operates as a blockchain-based virtual world platform where users own and trade virtual property through NFTs. DBR launched in October 2024 focusing on cross-chain infrastructure, while MANA has operated since 2017 as a metaverse ecosystem.
Q2: How do the current market positions of DBR and MANA compare?
A: As of December 19, 2025, MANA holds a stronger market position with a ranking of #197, market cap of $270.6 million, and 3.2x higher trading volume ($136,810.92) compared to DBR. DBR ranks #603 with a $202 million market cap and $42,560.55 daily volume. However, MANA suffers from a 97.9% decline from its 2021 peak, while DBR has declined 64.9% from its December 2024 peak.
II. Price Performance and Valuation
Q3: What are the historical price trends for both tokens?
A: deBridge (DBR) reached an all-time high of $0.05764 in December 2024, with a current price of $0.0202. Decentraland (MANA) peaked at $5.85 in November 2021, currently trading at $0.1234. MANA's 78.59% annual decline significantly outpaces DBR's 41.42% annual decline, reflecting broader metaverse sector underperformance versus emerging DeFi infrastructure demand.
Q4: What price forecasts are provided for 2025-2030?
A: DBR base case forecast for 2030 projects $0.0430 average price with upside to $0.0627 (112% total appreciation). MANA base case forecast for 2030 projects $0.1862 average price with upside to $0.2775 (50% total appreciation). Both forecasts assume institutional capital inflow, improved market sentiment, and ecosystem development over the five-year period.
III. Tokenomics and Supply Dynamics
Q5: How do the tokenomics models differ between DBR and MANA?
A: DBR operates with a fixed maximum supply of 10 billion tokens, currently 18% circulated (1.8 billion). This creates 82% dilution potential as remaining supply enters circulation. MANA has unlimited maximum supply with 87.5% currently circulated (1.92 billion from 2.19 billion total). DBR's capped model provides scarcity mechanics, while MANA's unlimited supply creates perpetual inflationary pressure but offers greater flexibility for ecosystem expansion.
IV. Risk Assessment
Q6: What are the primary risk factors for each token?
A: DBR faces cross-chain protocol vulnerabilities, limited operational testing history (under 3 months), and significant liquidity constraints (0.021% volume-to-market-cap ratio creating slippage risks). MANA faces persistent metaverse sector skepticism, Ethereum scaling limitations, unlimited supply inflation, and severe underperformance over the past two years. Both tokens operate in extreme fear sentiment conditions (index: 17), indicating heightened market uncertainty.
V. Investment Recommendations
Q7: Which token is more suitable for different investor types?
A: Beginner investors should prioritize MANA due to superior liquidity (65 exchange listings vs DBR's 26), longer operational history since 2017, and better trading accessibility. Experienced investors may allocate 20-30% to DBR for emerging infrastructure growth potential and 15-25% to MANA for recovery play exposure. Conservative investors should limit combined allocation to 10-15% maximum within diversified portfolios, while institutional investors should implement multi-phase accumulation strategies with stable coin reserves.
Q8: What trading volume and liquidity considerations should investors evaluate?
A: MANA provides significantly superior liquidity with 3.2x higher daily trading volume and broader exchange distribution (65 platforms), resulting in lower transaction slippage and better execution quality for institutional-scale positions. DBR's limited liquidity profile (0.021% volume-to-market-cap ratio) presents execution challenges for large transactions and higher price impact costs. MANA's superior infrastructure makes it preferable for traders requiring quick entry/exit, while DBR appeals to long-term holders willing to accept illiquidity constraints.
Disclaimer: This FAQ is based on reference materials through December 19, 2025, and does not constitute investment advice. Cryptocurrency investments carry substantial risk including potential total capital loss. Market forecasts are probabilistic scenarios subject to significant volatility. Investors must conduct independent research and consult qualified financial advisors before making investment decisions.
Share
Content
Introduction: DBR vs MANA Investment Comparison
I. Price History Comparison and Market Status
II. Price Movement Analysis
III. Project Overview and Functionality
IV. Tokenomics and Supply Dynamics
V. Market Position and Liquidity
VI. Risk Considerations
Executive Summary
I. Core Investment Value Factors
II. Factors Affecting DBR vs MANA Investment Value
III. Investment Considerations
IV. Disclaimer
III. 2025-2030 Price Forecast: DBR vs MANA
I. Investment Strategy Comparison: DBR vs MANA
II. Potential Risk Comparison
III. Conclusion: Which Is the Better Buy?
IV. Price Forecast Summary (2025-2030)
V. Final Assessment
I. Basic Token Information
II. Price Performance and Valuation
III. Tokenomics and Supply Dynamics
IV. Risk Assessment
V. Investment Recommendations
How to Buy Cryptocurrency


Trending Cryptocurrencies


Hashflow: Revolutionizing DEX With Zero Slippage and MEV-Resistance

Is altcoin season coming?

What is OKB: A Comprehensive Guide to OKR's Blockchain Sibling

What is MYX: Understanding the Innovative Cryptocurrency Exchange Platform
What is CAKE: Understanding the Popular Cryptocurrency and DeFi Platform
What Is AVNT Coin? Beginner's Guide to the Token

Steps to Purchase EOS Tokens Securely
Beginner's Guide to Simulated Bitcoin Trading: Exploring Paper Trading in Crypto

Understanding Decentralized Applications: A Comprehensive Guide

Guide to Claiming Your ZkSync Airdrop

Exploring Effective Strategies for DeFi Liquidity Mining