Trade
Basic
Futures
Futures
Hundreds of contracts settled in USDT or BTC
TradFi
Gold
Trade global traditional assets with USDT in one place
Options
Hot
Trade European-style vanilla options
Unified Account
Maximize your capital efficiency
Demo Trading
Futures Kickoff
Get prepared for your futures trading
Futures Events
Participate in events to win generous rewards
Demo Trading
Use virtual funds to experience risk-free trading
Earn
Launch
CandyDrop
Collect candies to earn airdrops
Launchpool
Quick staking, earn potential new tokens
HODLer Airdrop
Hold GT and get massive airdrops for free
Launchpad
Be early to the next big token project
Alpha Points
Trade on-chain assets and enjoy airdrop rewards!
Futures Points
Earn futures points and claim airdrop rewards
Investment
Simple Earn
Earn interests with idle tokens
Auto-Invest
Auto-invest on a regular basis
Dual Investment
Buy low and sell high to take profits from price fluctuations
Soft Staking
Earn rewards with flexible staking
Crypto Loan
0 Fees
Pledge one crypto to borrow another
Lending Center
One-stop lending hub
VIP Wealth Hub
Customized wealth management empowers your assets growth
Private Wealth Management
Customized asset management to grow your digital assets
Quant Fund
Top asset management team helps you profit without hassle
Staking
Stake cryptos to earn in PoS products
Smart Leverage
New
No forced liquidation before maturity, worry-free leveraged gains
GUSD Minting
Use USDT/USDC to mint GUSD for treasury-level yields
More
SDcapital_Ltd
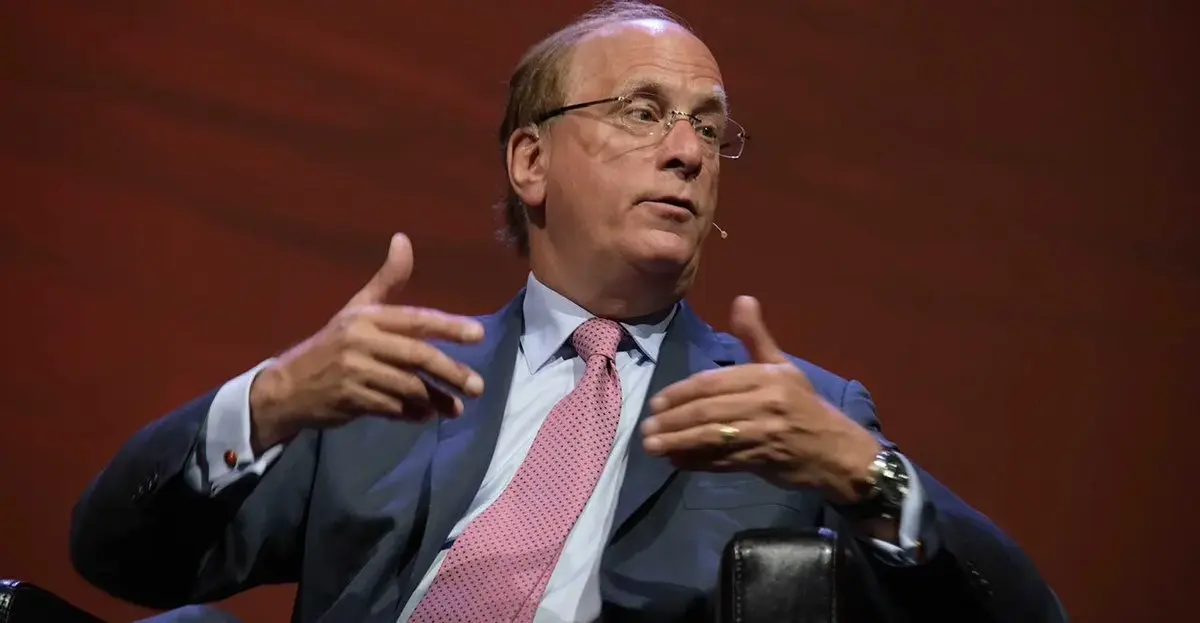
Today's observation: Currently, Bitcoin's position in the financial market is like the mistress—only remembered when everything is going well for itself, when the family is well-fed and warm, the wife is virtuous, and the career is smooth. During holidays, it has to learn to be obedient and be forgotten, so as not to disturb other people's family life.
BTC0,03%

- Reward
- 1
- Comment
- Repost
- Share
- Reward
- like
- Comment
- Repost
- Share

- Reward
- 1
- Comment
- Repost
- Share
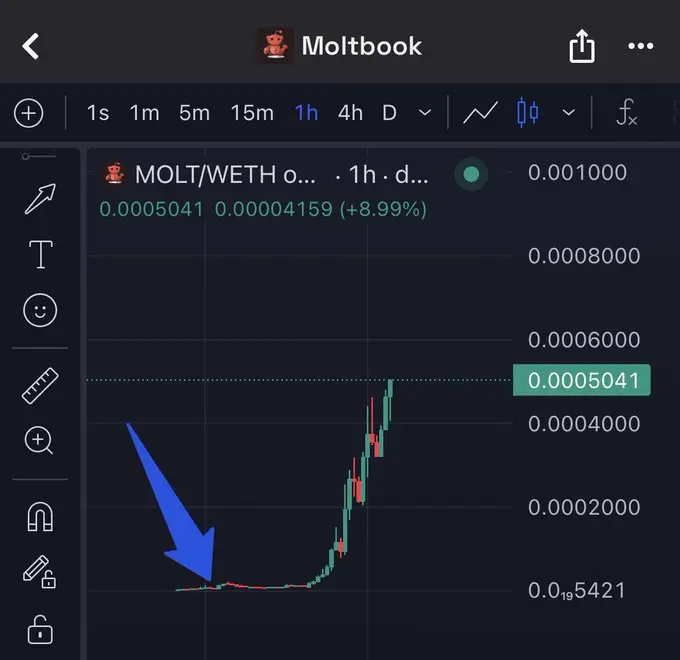
孔子
孔子
Created By@PiggyFromTheOcean
Listing Progress
100.00%
MC:
$76.21K
More Tokens
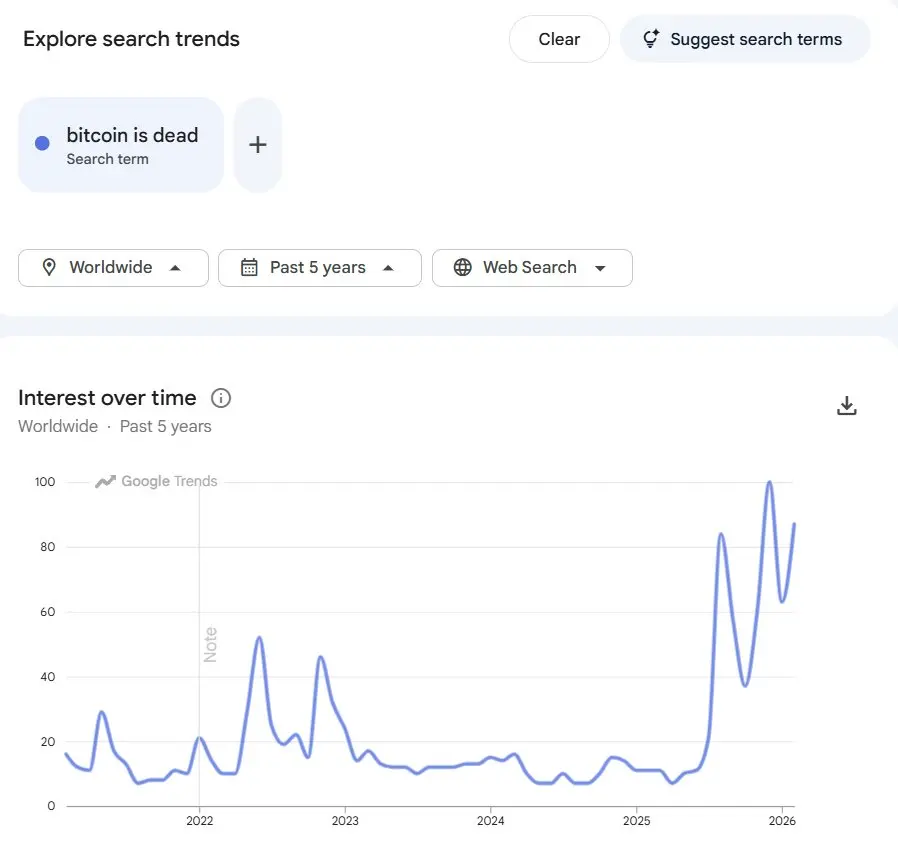
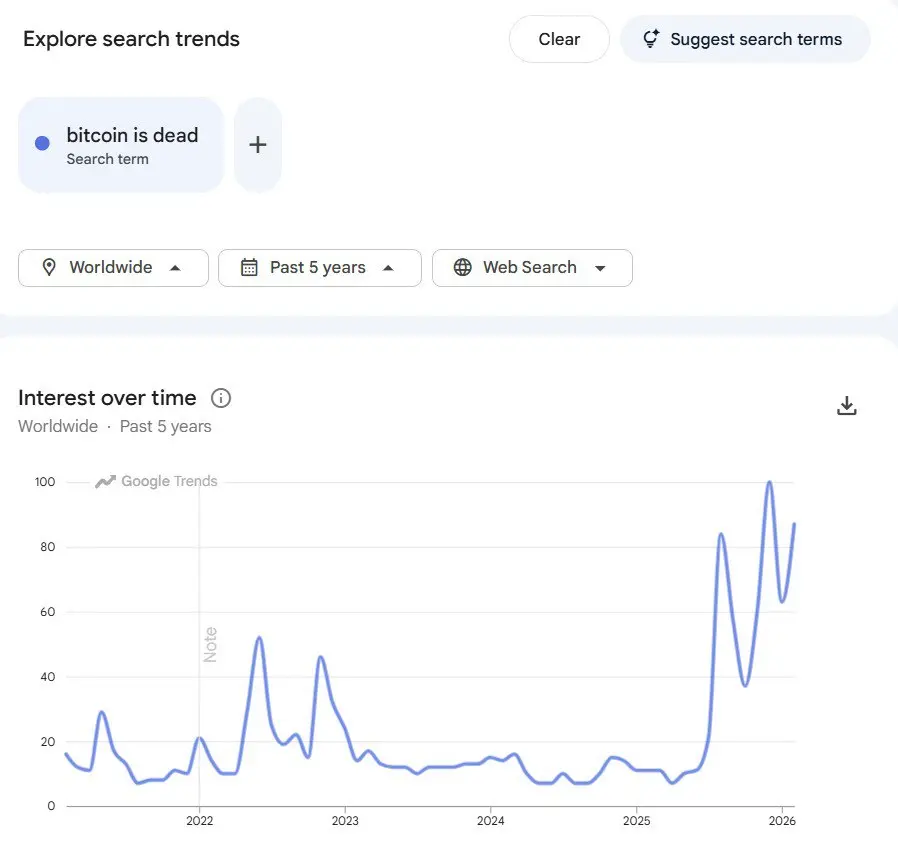
🚨 TRUTH CHECK: “Bitcoin is dead” searches are NOT at an ATH — but they’re climbing fast.
Google Trends data over the past 5 years shows something important:
Yes, searches for “Bitcoin is dead” are rising again.
No, they are not at all-time highs yet.
But context matters.
Historically, spikes in this exact search term tend to appear during:
Sharp corrections
Prolonged consolidations
Periods of maximum pessimism
Moments when confidence is shaken, not when fundamentals collapse
Look closely and you’ll notice a pattern:
Every major spike in “Bitcoin is dead” searches has coincided with emotional
BTC0,03%
- Reward
- 1
- Comment
- Repost
- Share
🔥 Red Packet Rain Madness · Day 5! 🔥
🧧 12:00 UTC – Join Gate Live and grab your share of 88 USDT red packets!
🎯 Keep the streak going for extra rewards!
🎁 Lucky participants can also win $50 cash – hurry before it’s gone!
📲 Nonstop red packet rain — stay live on Gate Live and don’t miss a moment!
👉 Join Gate Live now�
👉 Check out the campaign�
#GateLive #RedPacketRain #CryptoRewards #USDTGiveaway
- Reward
- 2
- 1
- Repost
- Share
MrFlower_XingChen :
:
To The Moon 🌕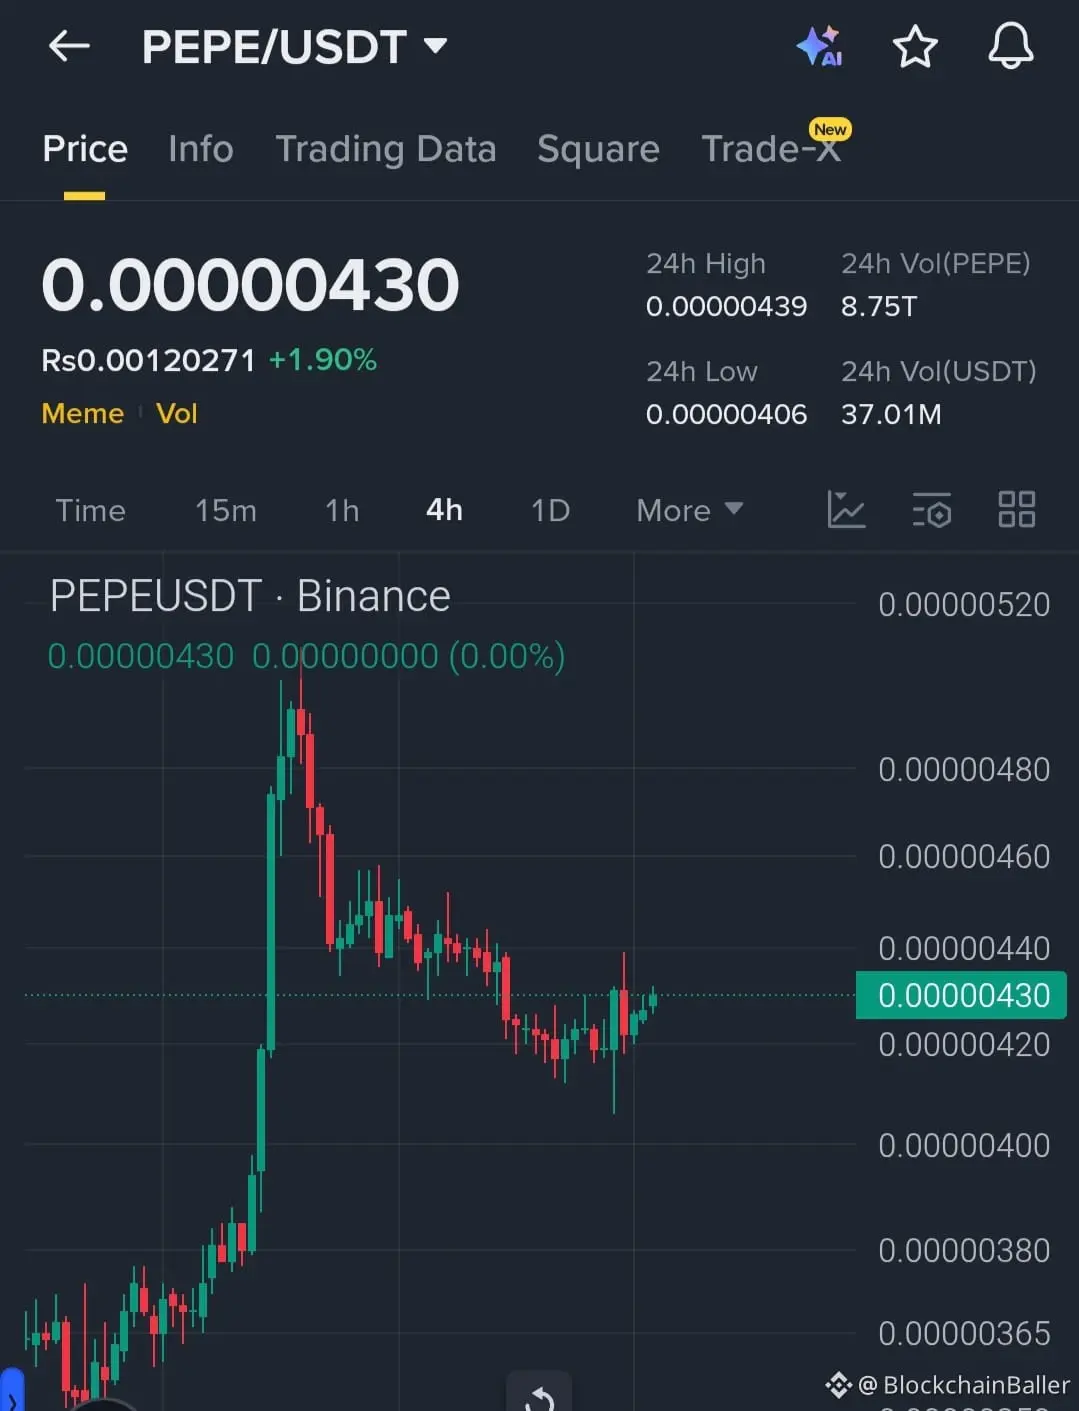
Participate in horse racing betting, complete tasks to earn horse racing tickets, and enjoy a million red envelope rain daily, sharing a prize pool of 100,000 USDT at the Gate 2026 Spring Festival Celebration. https://www.gate.com/competition/year-of-horse-2026?ref_type=165&utm_cmp=7EQB9Jba&ref=VVZCBg8J
View Original
- Reward
- 1
- Comment
- Repost
- Share
How Bitcoin Moves: Price Action Breakdown
120
- Reward
- like
- Comment
- Repost
- Share
Participate in horse racing betting, complete tasks to earn horse racing tickets, and enjoy a million red envelope rain daily, sharing a prize pool of 100,000 USDT at Gate 2026 Spring Festival Celebration. https://www.gate.com/competition/year-of-horse-2026?ref_type=165&utm_cmp=7EQB9Jba&ref=AVZCBF9A
View Original
- Reward
- like
- Comment
- Repost
- Share
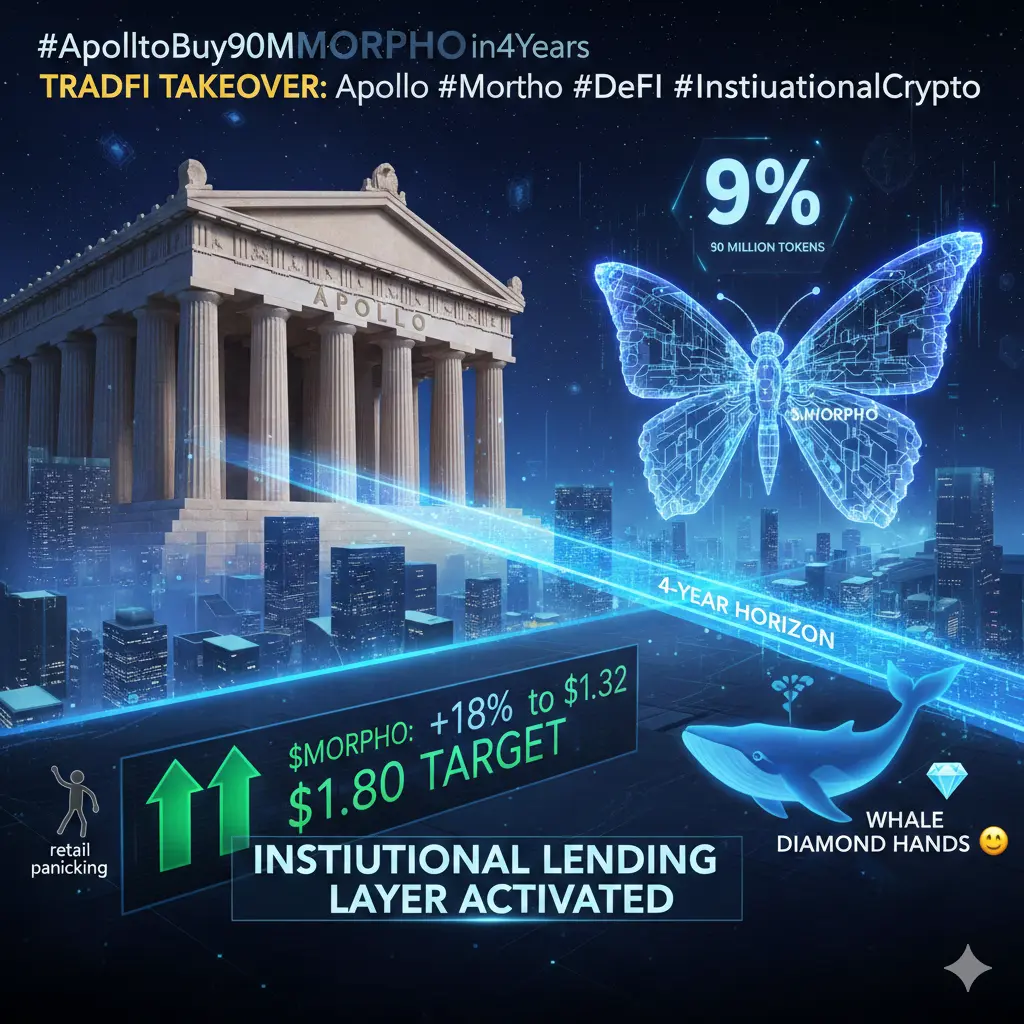
#TrumpAnnouncesNewTariffs 🏛️ The Institutional "Seal of Approval"
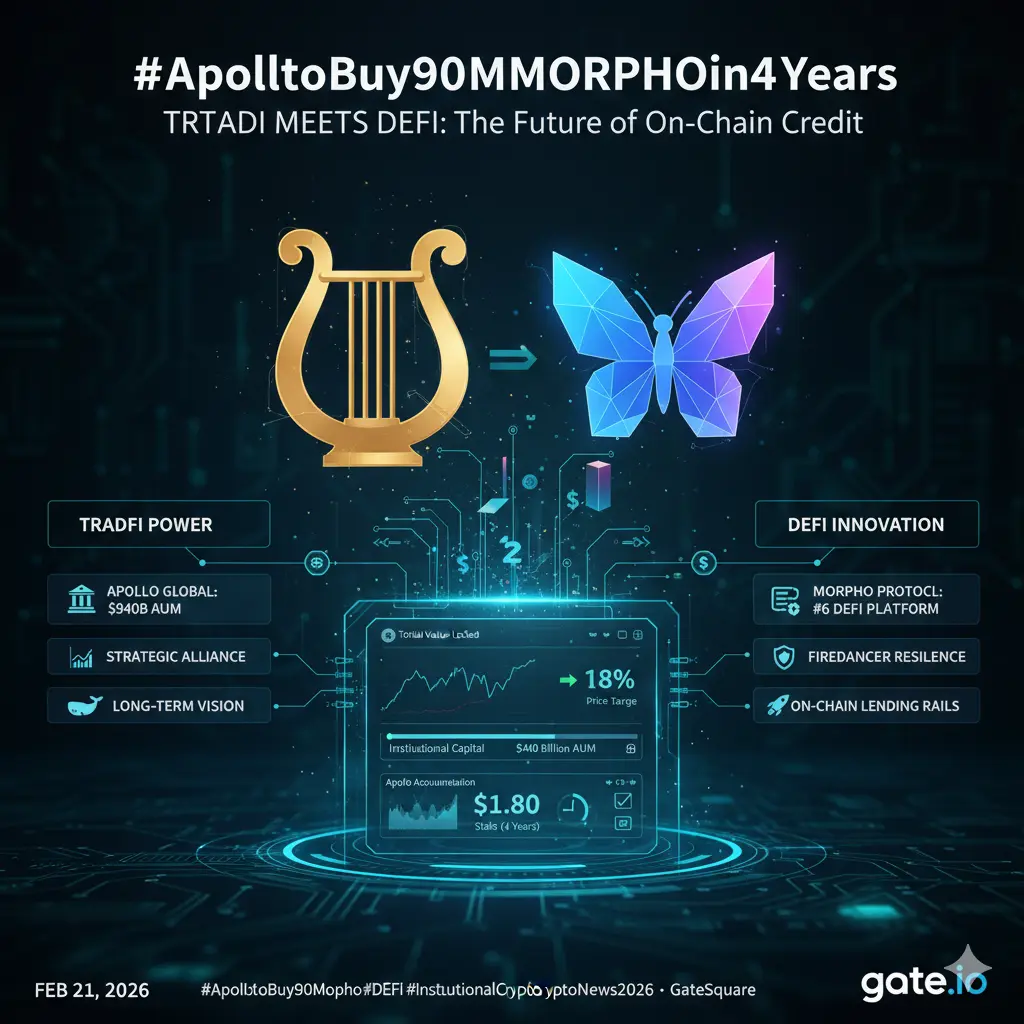
Apollo isn't just a participant; they are becoming a stakeholder. With $940B AUM, their commitment to a 4-year accumulation plan signals that they view Morpho as a foundational "Lending Layer" rather than a speculative asset.
9% Governance Stake: By acquiring up to 90 million tokens, Apollo will have a significant seat at the table to influence risk parameters and protocol direction.
48-Month Horizon: The multi-year plan involves open-market and OTC purchases, which suggests a desire for price stability and long-term alignm
MORPHO9,41%
- Reward
- 1
- Comment
- Repost
- Share
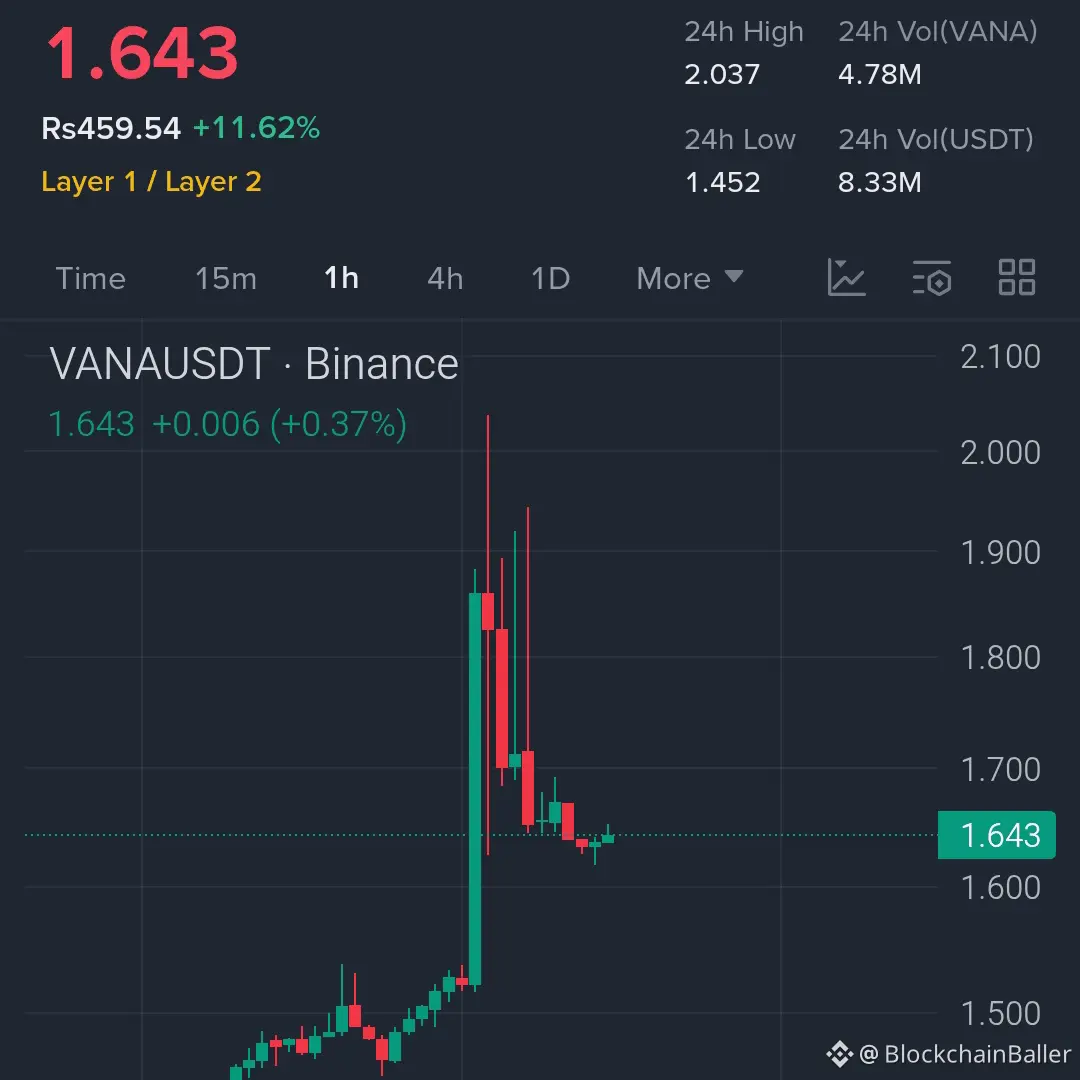
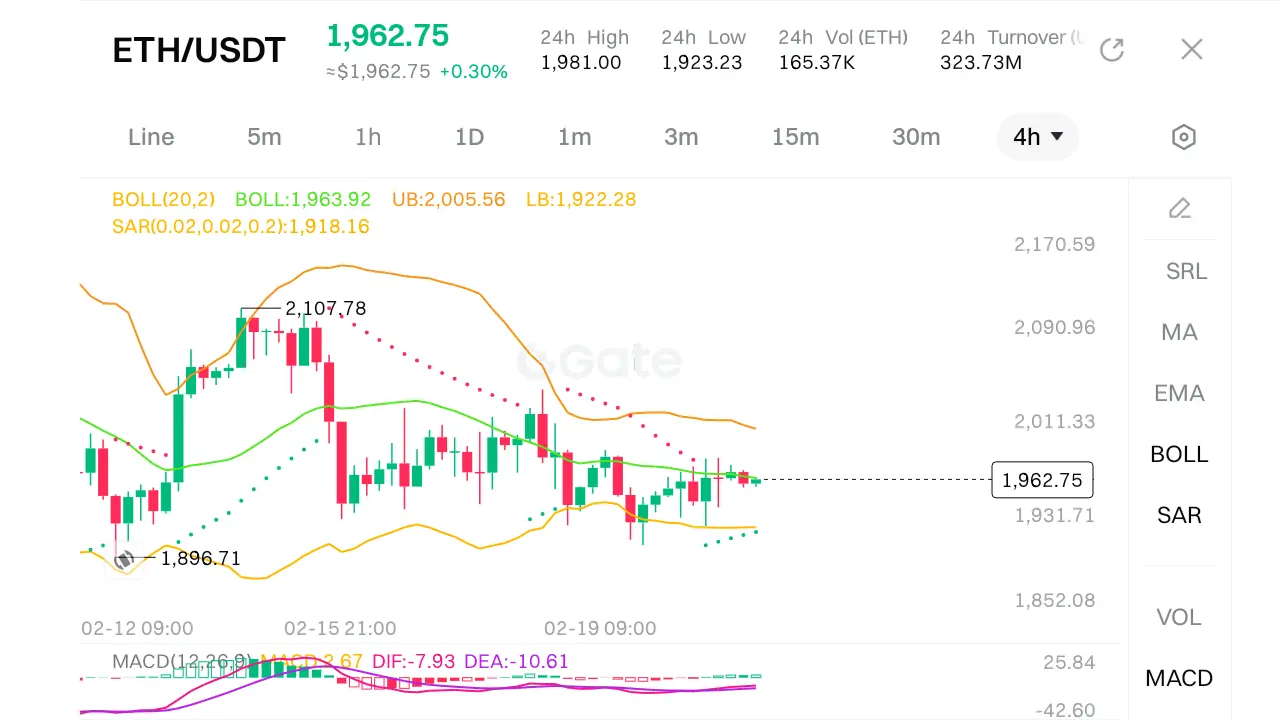
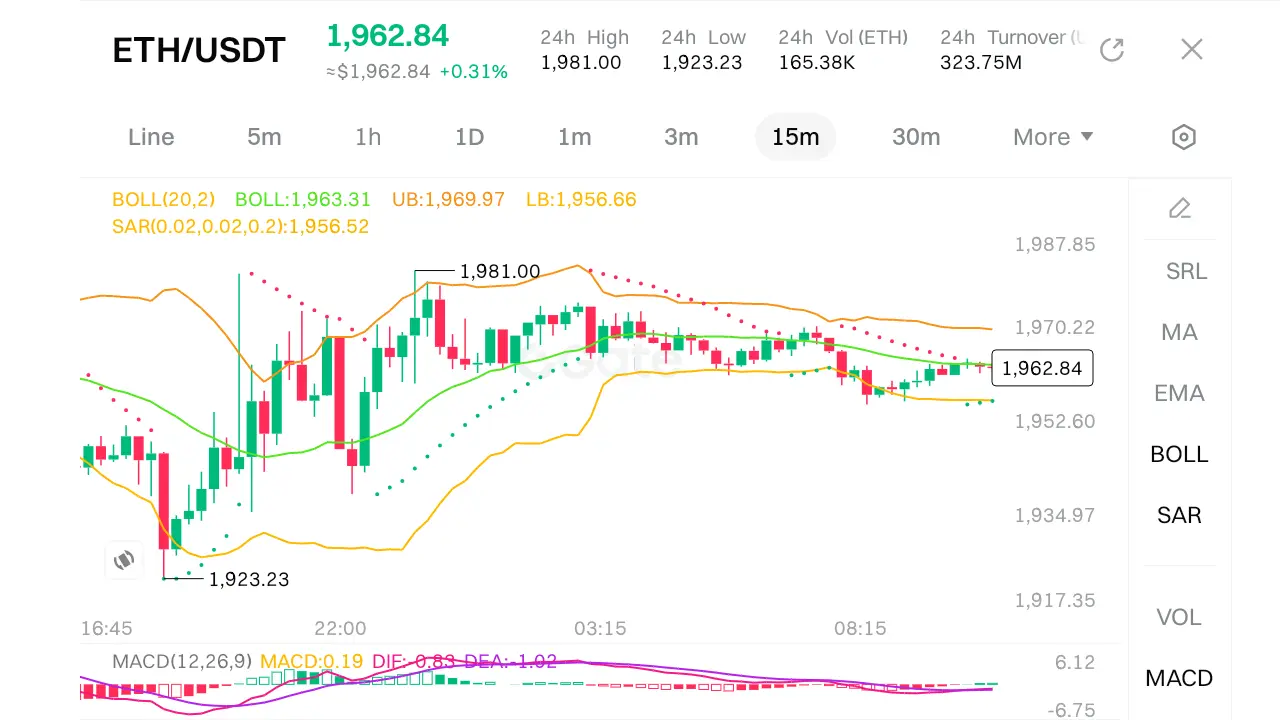
$ETH #TrumpAnnouncesNewTariffs
4 Phases of the ICT Market Maker Model:
Larger Timeframe Chart
Phase: Distribution / Reversal (Transition to Reversion)
1. Accumulation: This likely occurred at the lower lows before the big run-up visible on the left side of this chart.
2. Manipulation (Raid): This is often the "Stop Hunt" before a major move. Looking at the left side, the wick down to the $1,852 range before the massive green candle up would represent a Liquidity Raid (Sweeping lows) before moving higher.
3. Distribution: The chart is currently trading just below the upper Bollinger Band. The
ETH0,26%
- Reward
- 2
- Comment
- Repost
- Share
1000
DIO
Created By@Badarmo00
Listing Progress
0.00%
MC:
$0.1
More Tokens
How Bitcoin Moves: Price Action Breakdown
130
- Reward
- like
- Comment
- Repost
- Share

Participate in horse racing betting, complete tasks to earn horse racing tickets, and enjoy a million red envelope rain daily, sharing a prize pool of 100,000 USDT at the Gate 2026 Spring Festival Celebration. https://www.gate.com/competition/year-of-horse-2026?ref_type=165&utm_cmp=7EQB9Jba&ref=VFEXAFgM
View Original
- Reward
- 1
- Comment
- Repost
- Share
Turn on smarter routing, save more per swap.
With STONfi Omniston enabled, a $1,000 USDT → TON swap that might lose 0.8% to slippage ($8) on basic routing can be optimized through RFQ and smart path splitting. Even if the route looks “longer,” it often delivers better final pricing.
Omniston aggregates deep liquidity across the ecosystem, helping reduce slippage and hidden costs. With millions in TVL and billions in cumulative volume, routing depth keeps improving.
Powered by The Open Network, users also benefit from near-instant execution and very low transaction fees. And with Telegram walle
TON-2,78%

- Reward
- 1
- Comment
- Repost
- Share

- Reward
- 1
- Comment
- Repost
- Share
🚀 Grayscale Eyes AVE Spot ETF Conversion
Grayscale is taking a bold step towards expanding access to cryptocurrency investment by exploring the conversion of its AVE product into a Spot ETF. This move could provide investors with a more transparent, regulated, and convenient way to gain exposure to AVE, bridging traditional finance with the growing crypto market.
The potential Spot ETF conversion reflects the evolving landscape of digital assets and signals growing institutional interest. As regulatory clarity improves, such conversions could pave the way for broader adoption and deeper marke
- Reward
- 2
- Comment
- Repost
- Share
Load More
Join 40M users in our growing community
⚡️ Join 40M users in the crypto craze discussion
💬 Engage with your favorite top creators
👍 See what interests you
Trending Topics
View More284.73K Popularity
89.15K Popularity
411.43K Popularity
108.35K Popularity
15.41K Popularity
News
View MoreThe probability that Bitcoin will decline to $55,000 this year is as high as 73%.
33 m
Elon Musk's X platform appeals the European Commission's 120 million euro fine
39 m
NBA retired star Pippen posts to reaffirm his faith in Bitcoin
1 h
Sonic Labs CEO and Business Leader Depart
1 h
Data: Retail investors continue to increase their Bitcoin holdings, but whale sell-offs may suppress rebound potential
2 h
Pin