Trade
Basic
Futures
Futures
Hundreds of contracts settled in USDT or BTC
Options
HOT
Trade European-style vanilla options
Unified Account
Maximize your capital efficiency
Demo Trading
Futures Kickoff
Get prepared for your futures trading
Futures Events
Futures Mall
Participate in events to win generous rewards
Demo Trading
Use virtual funds to experience risk-free trading
Earn
Launch
CandyDrop
Collect candies to earn airdrops
Launchpool
Quick staking, earn potential new tokens
HODLer Airdrop
Hold GT and get massive airdrops for free
Launchpad
Be early to the next big token project
Alpha Points
NEW
Trade on-chain assets and enjoy airdrop rewards!
Futures Points
NEW
Earn futures points and claim airdrop rewards
Investment
Simple Earn
Earn interests with idle tokens
Auto-Invest
Auto-invest on a regular basis
Dual Investment
Buy low and sell high to take profits from price fluctuations
Soft Staking
Earn rewards with flexible staking
Crypto Loan
0 Fees
Pledge one crypto to borrow another
Lending Center
One-stop lending hub
VIP Wealth Hub
Customized wealth management empowers your assets growth
Private Wealth Management
Customized asset management to grow your digital assets
Quant Fund
Top asset management team helps you profit without hassle
Staking
Stake cryptos to earn in PoS products
Smart Leverage
NEW
No forced liquidation before maturity, worry-free leveraged gains
GUSD Minting
Use USDT/USDC to mint GUSD for treasury-level yields
More
Mr.AInTheCryptoCircle
At 3:30 a.m. on Thursday, the market will迎来 the "world's most expensive sound."
The first words Powell speaks are not greetings, but direction.
Is it a "Good afternoon" or "Hello everyone,"
both could determine the capital flow and market sentiment in the coming period. ##鲍威尔发言 #ETH走势分析
The first words Powell speaks are not greetings, but direction.
Is it a "Good afternoon" or "Hello everyone,"
both could determine the capital flow and market sentiment in the coming period. ##鲍威尔发言 #ETH走势分析
ETH2,39%

- Reward
- 1
- Comment
- Repost
- Share
Entering the market is effortful.
View Original

- Reward
- 1
- Comment
- Repost
- Share
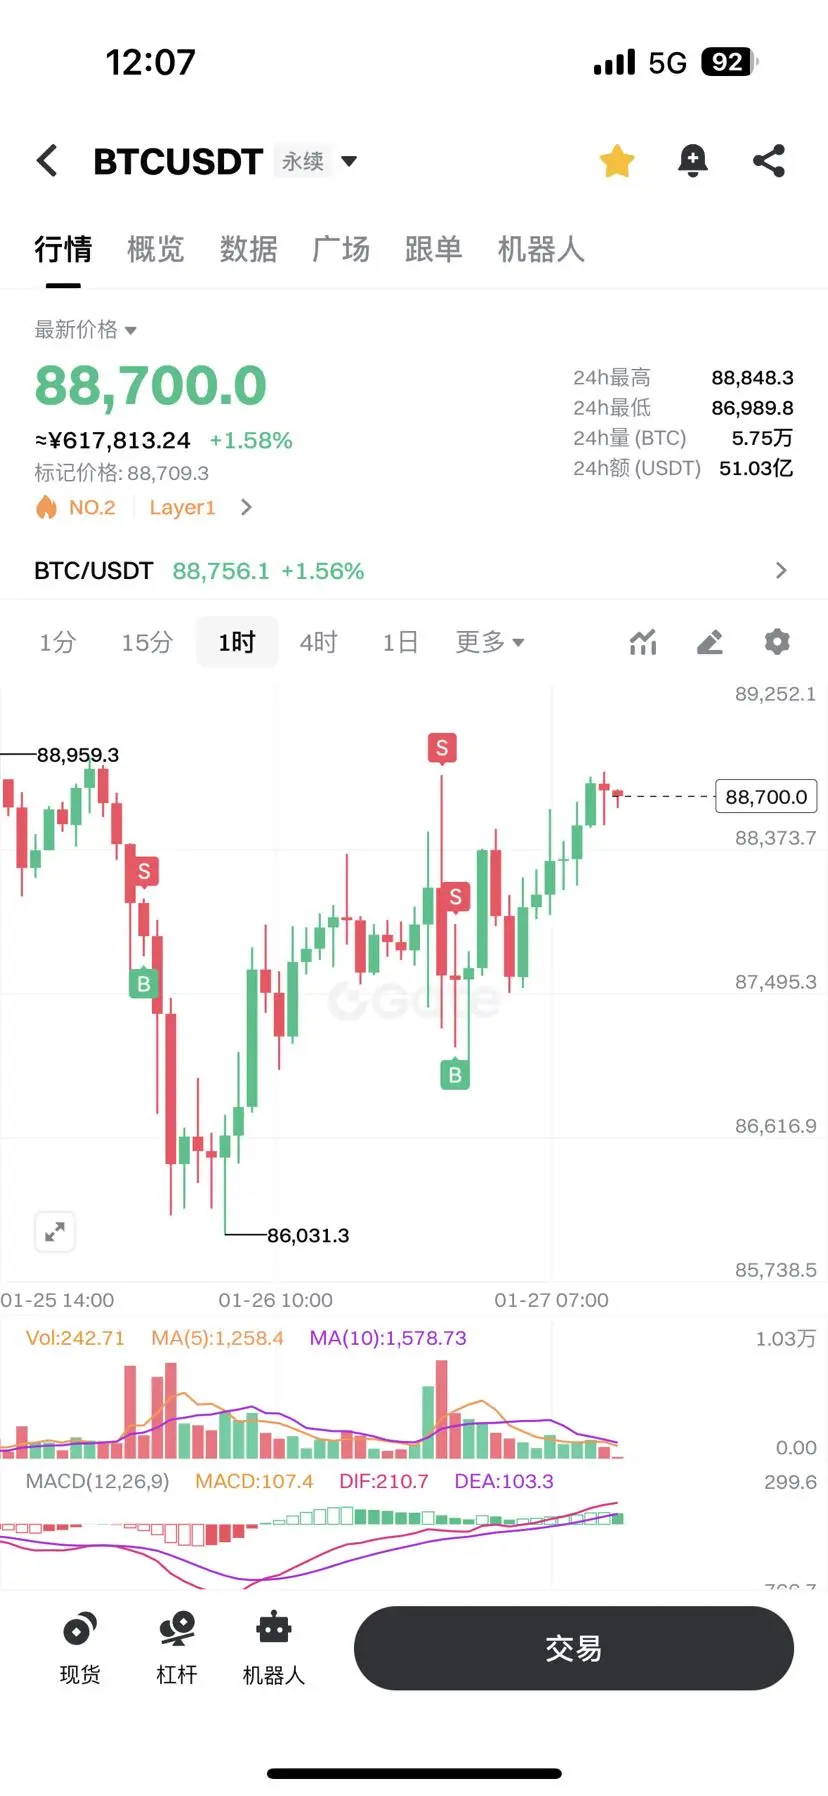
Emphasis on gradual entry: in the short term, correction can be used as an entry point; medium term, the upward potential remains if it consolidates above 86,000 USDT and demand from ETF investors returns.$BTC
Short-term plan: buy📈
Entry: 86,000 USDT (volume 30%)
Stop-loss: 82,000 USDT
Take-profit: 88,800 USDT
Medium-term plan: buy📈
Entry: 84,000 USDT (volume 40%)
Stop-loss: 80,000 USDT
Take-profit: 97,000 USDT
Short-term plan: buy📈
Entry: 86,000 USDT (volume 30%)
Stop-loss: 82,000 USDT
Take-profit: 88,800 USDT
Medium-term plan: buy📈
Entry: 84,000 USDT (volume 40%)
Stop-loss: 80,000 USDT
Take-profit: 97,000 USDT
BTC0,74%


- Reward
- 2
- 1
- Repost
- Share
RedEnvelope:
Follow 🔍 closelyMYJB
蚂蚁金币
Created By@MunanYiBufan
Listing Progress
100.00%
MC:
$8.6K
Create My Token


Family members, look here! I warned this morning that the pressure level would pull back, and now it has accurately dropped about 30 points! Those who kept up with the rhythm have already made a profit!
Follow me so you won't get lost! I post updates daily at 8:30 AM and 8:30 PM sharp. Morning alerts are valid throughout the day, and evening alerts last until the next morning's session! Real-time market predictions, precise levels without fuss. Hurry up and follow, so you can be one step ahead in bottom fishing and top escaping!
View OriginalFollow me so you won't get lost! I post updates daily at 8:30 AM and 8:30 PM sharp. Morning alerts are valid throughout the day, and evening alerts last until the next morning's session! Real-time market predictions, precise levels without fuss. Hurry up and follow, so you can be one step ahead in bottom fishing and top escaping!

- Reward
- 1
- 1
- Repost
- Share
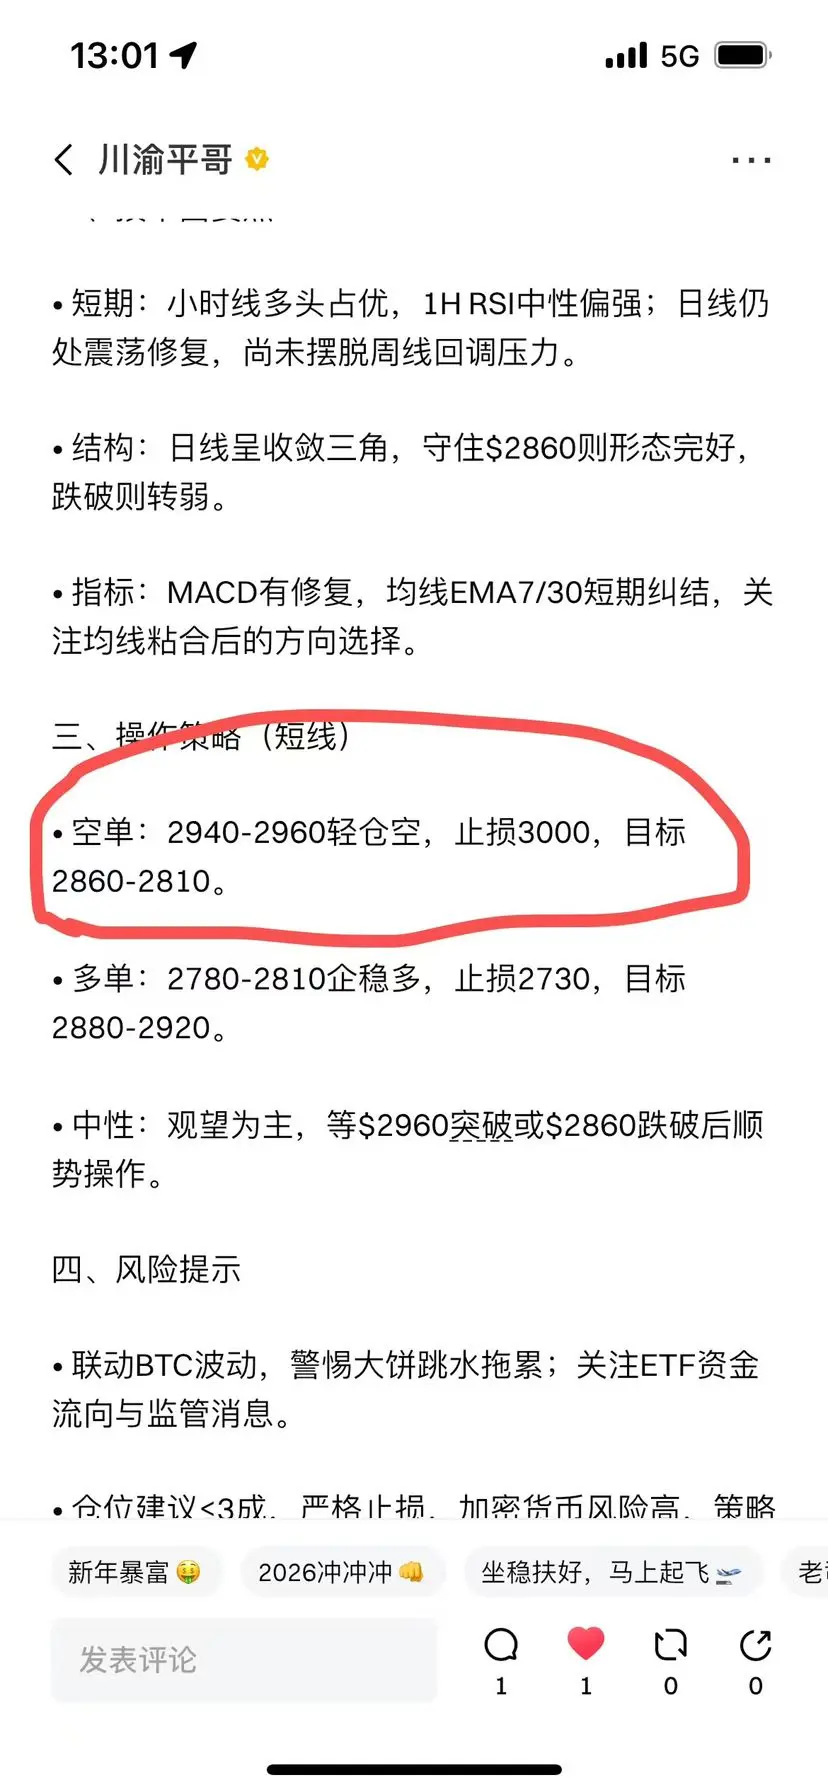
川渝平哥 :
:
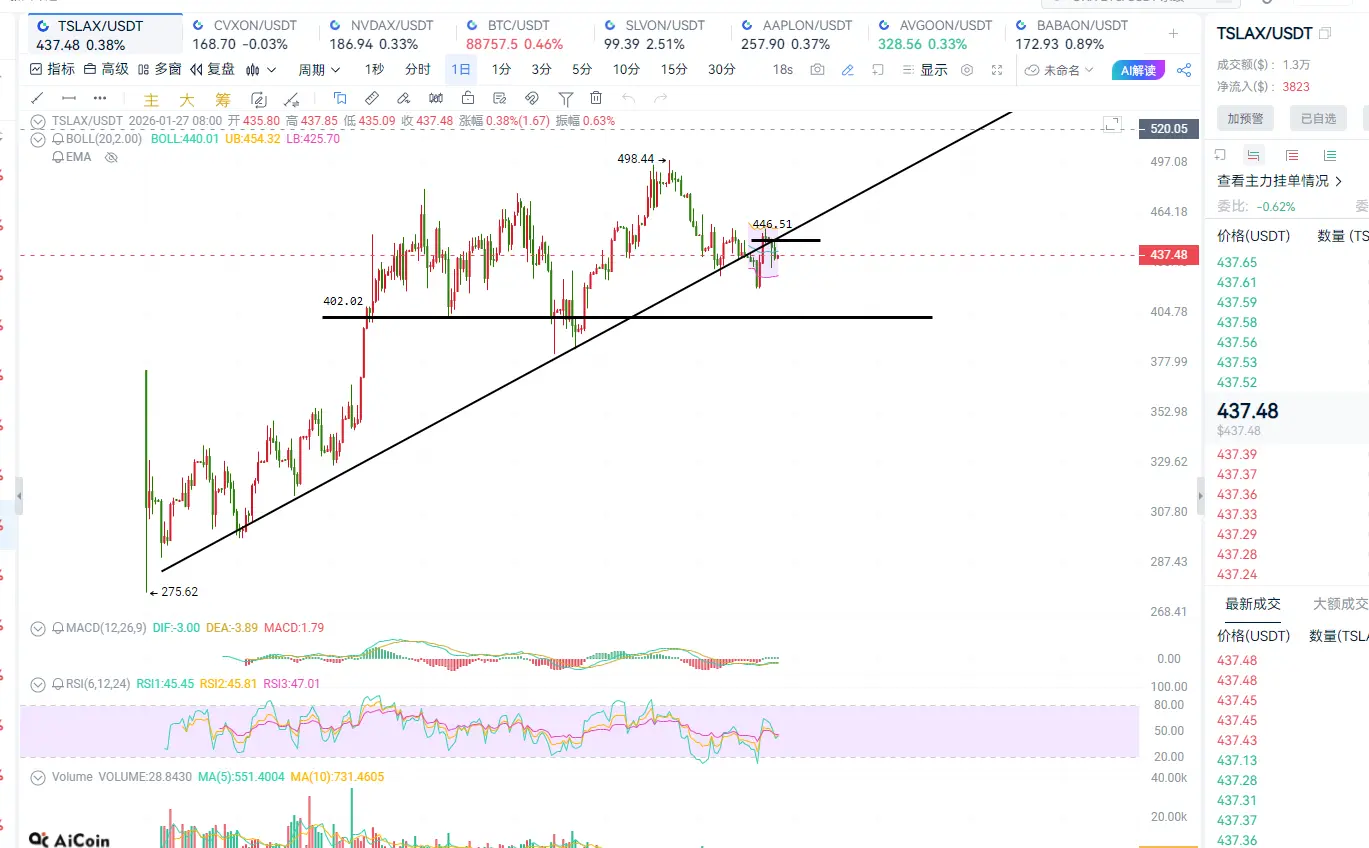
It has retraced about 30 from 2940! Now around 2960, it is also in a retracement!Spot = Stocks. TSLAX recently broke below the upward trend. This coin is issued in batches for dip buying or dollar-cost averaging.
It is a tokenized stock launched by the Swiss compliant asset tokenization platform Backed Finance, which 1:1 maps to Tesla (TSLA) stock prices, fully collateralized by real stocks, issued cross-chain on Solana and Ethereum, targeting non-US qualified investors, providing compliant on-chain US stock exposure. The following introduces the core mechanisms, technology and compliance, trading and value, risks and limitations.
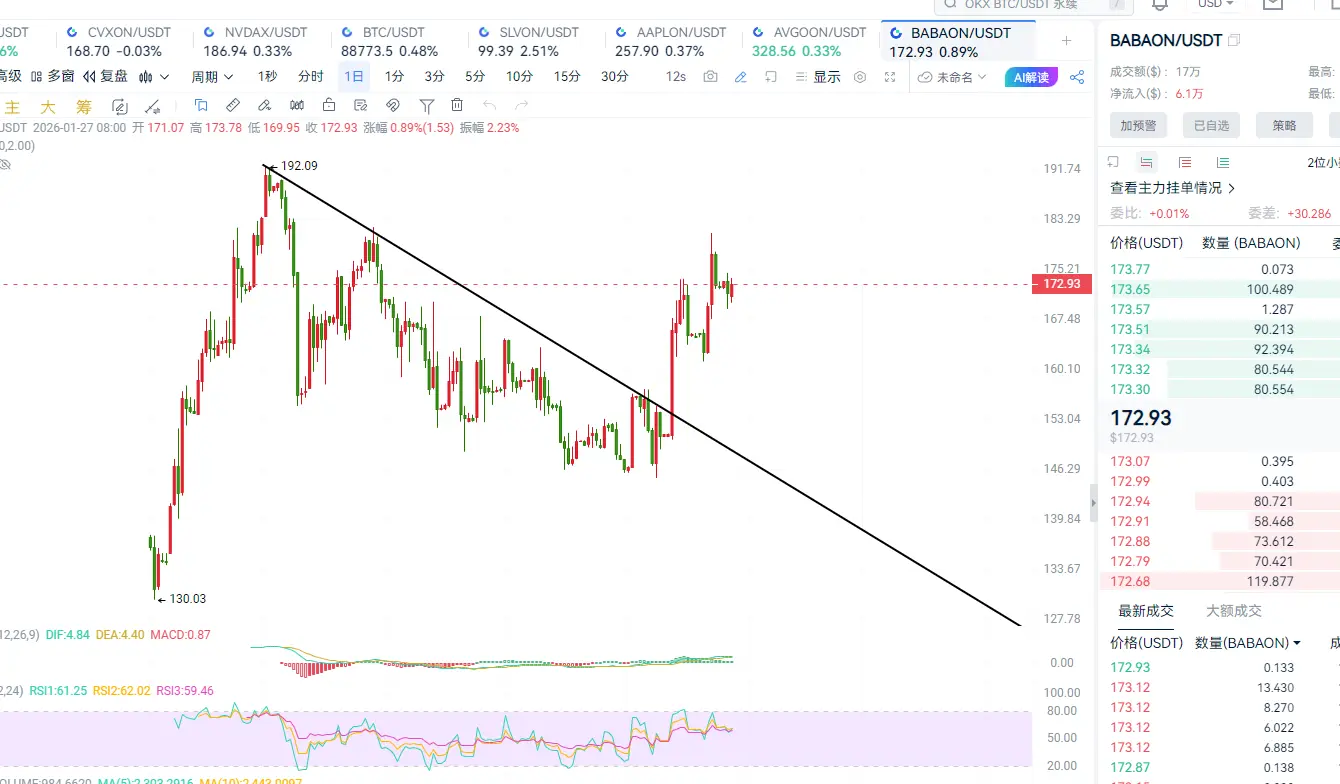
babaon Alibaba Coin recently reversed fr
View OriginalIt is a tokenized stock launched by the Swiss compliant asset tokenization platform Backed Finance, which 1:1 maps to Tesla (TSLA) stock prices, fully collateralized by real stocks, issued cross-chain on Solana and Ethereum, targeting non-US qualified investors, providing compliant on-chain US stock exposure. The following introduces the core mechanisms, technology and compliance, trading and value, risks and limitations.
babaon Alibaba Coin recently reversed fr
- Reward
- 1
- 1
- Repost
- Share
HighAmbition:
2026 GOGOGO 👊🚨 BREAKING | ARENAR INTEL:🇺🇸🇮🇷 U.S. intelligence says Iran is at its weakest since 1979. President Trump has been briefed and warned that military action is possible, per NYT.#BreakingNews #WorldNews

- Reward
- like
- Comment
- Repost
- Share
- Reward
- like
- 7
- Repost
- Share
GateUser-d965166e:
I can only say you're really stupid.View More
- Reward
- like
- Comment
- Repost
- Share
- Reward
- like
- Comment
- Repost
- Share
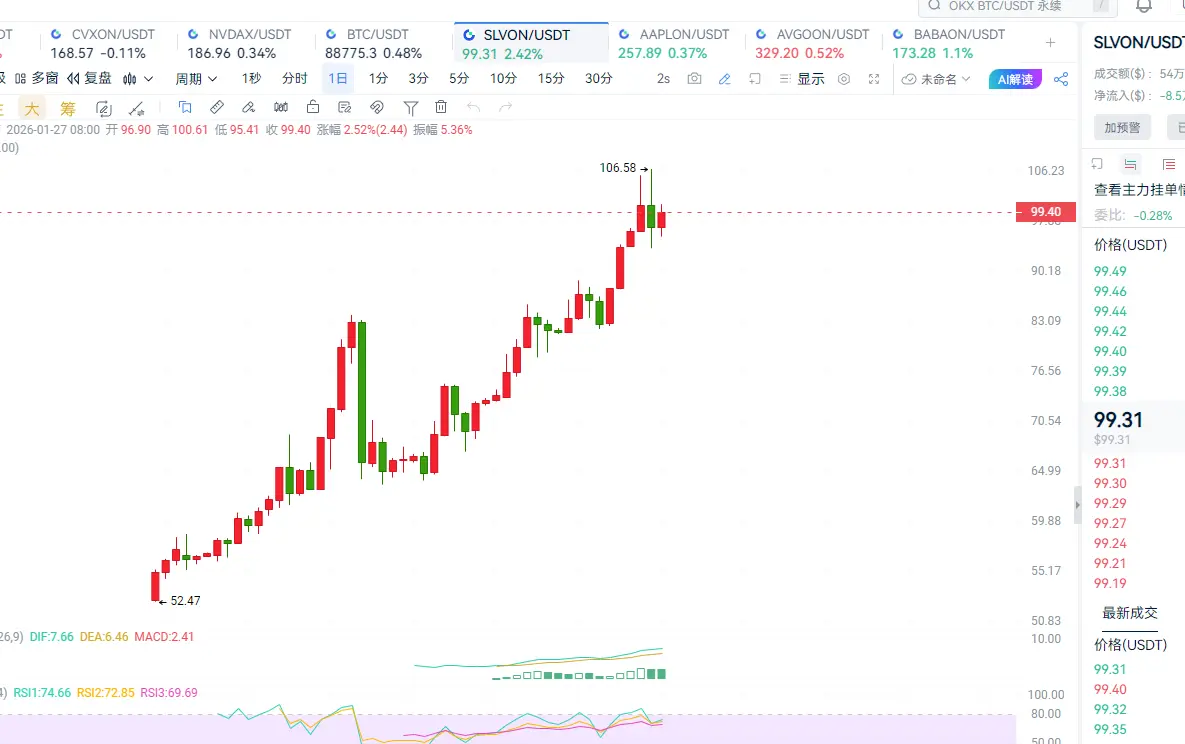
Viewing the Top Market Coins Spot Chart and comparing them
0
- Reward
- 9
- 3
- Repost
- Share
ybaser:
2026 GOGOGO 👊2026 GOGOGO 👊View More
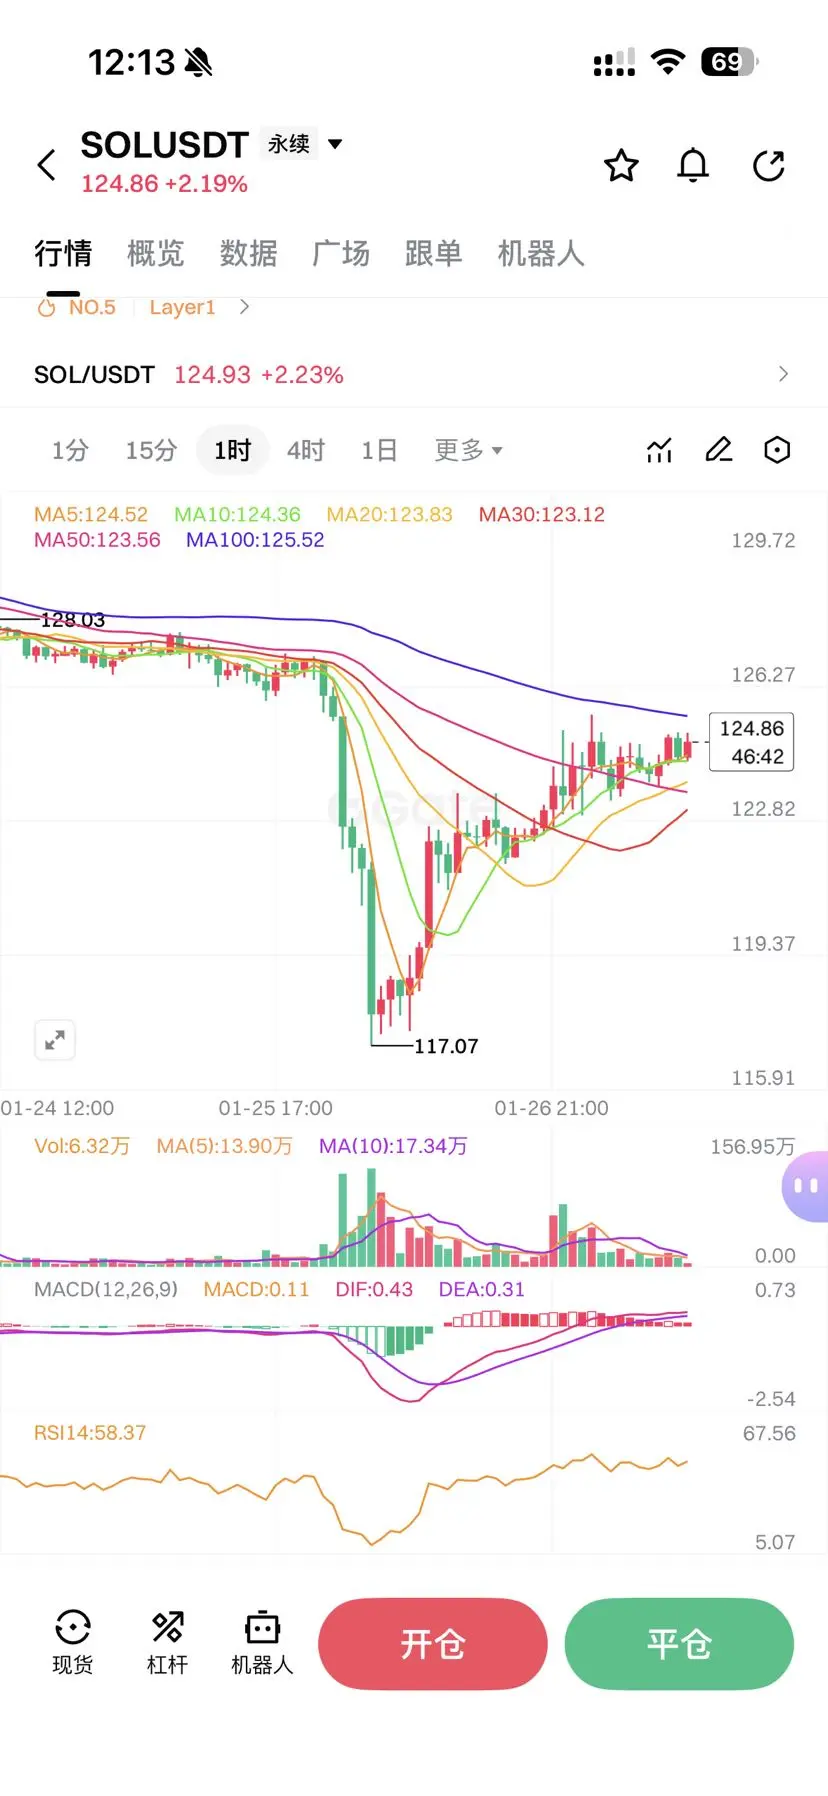
SOL/USDT 1-Hour K-Line Analysis: Rebound Momentum Continues, Short-Term Bulls Are Dominant
Key Support and Resistance Levels
• Resistance Levels
1. First Resistance: 125.52 (MA100), a key barrier for short-term rebound, a breakout can target 128.03 (Previous High).
2. Second Resistance: 128.03 (Previous High), an important psychological resistance level, breaking through will open further upside space.
3. Third Resistance: 129.72 (Recent High), only confirmed after breakout can the medium-term rebound trend be validated.
• Support Levels
1. First Support: 124.52 (MA5), the current short-term s
SOL1,3%


- Reward
- like
- Comment
- Repost
- Share
🔹 Precious metals surge masks the strengthening crypto fundamentals, ETH and BTC
1
- Reward
- like
- Comment
- Repost
- Share
MNVA
Metanova
Created By@MeatMemed
Subscription Progress
0.00%
MC:
$0
Create My Token
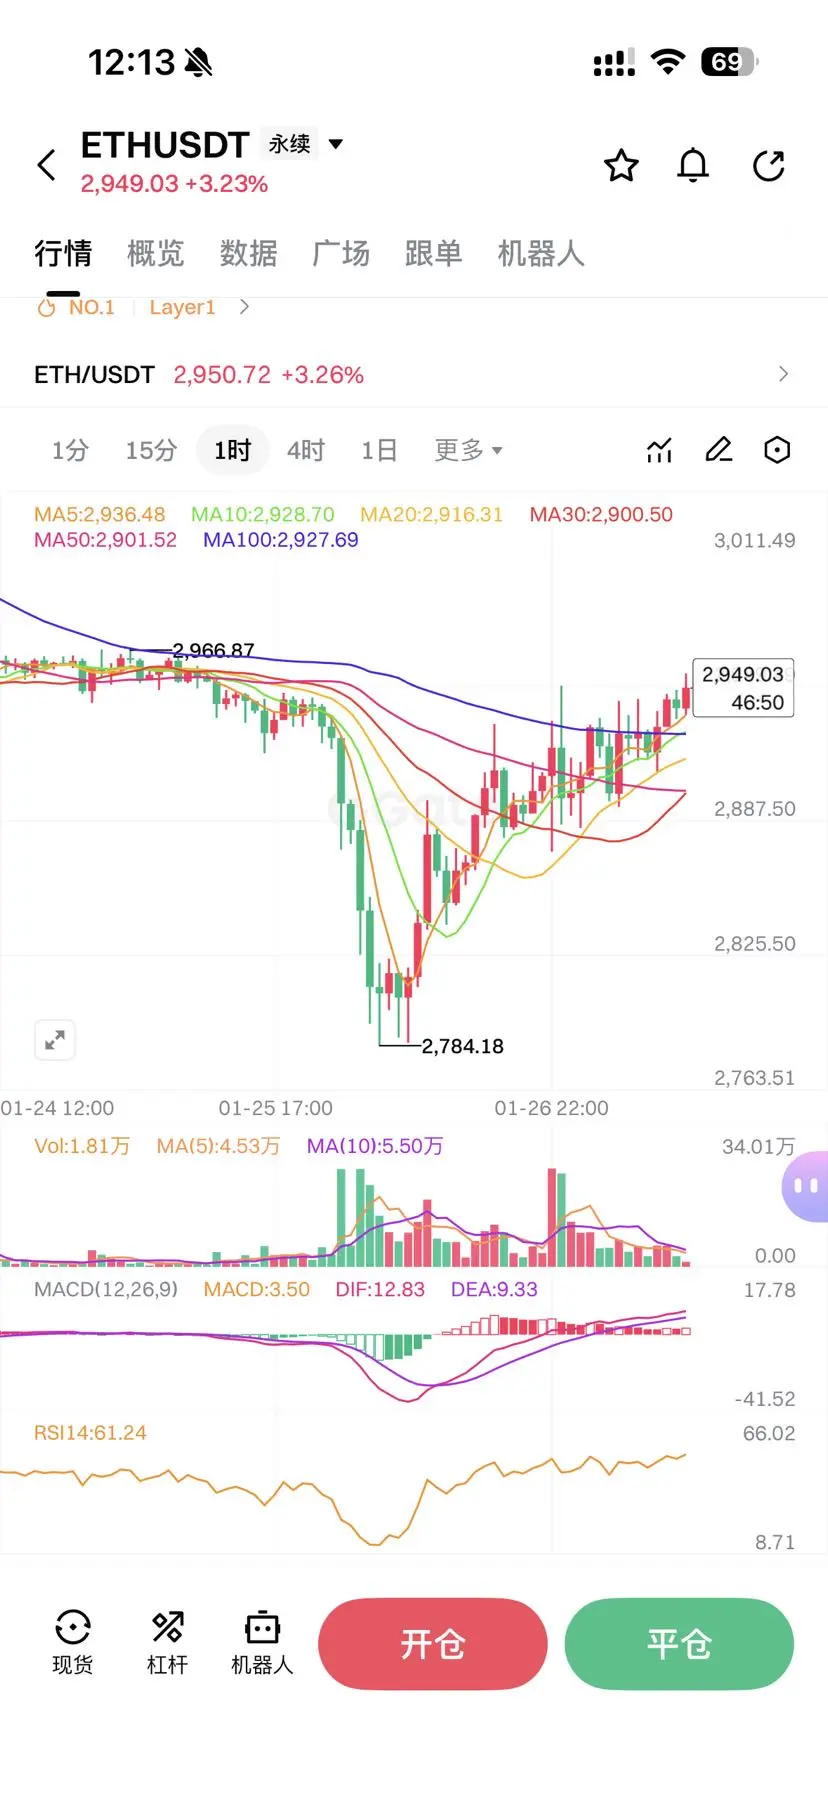
ETH Market Analysis
January 27, 2025, 10:00 AM ETH Today Market Analysis
As of 10 PM, the candlestick chart shows a downward correction trend.
The price is around 2935, with the Bollinger Bands three lines parallel, near 2920, 3010, and 2830.
Short-term MA moving averages: MA5 and MA10 form a golden cross and are rising, with the gap widening.
MACD indicator: The MACD double lines are below the zero line, forming a golden cross and rising, indicating bullish momentum is building.
RSI indicator: RSI14 is around 50, indicating a normal trading phase.
Resistance levels: 2965, 3025, 3080
Support l
ETH2,39%

- Reward
- like
- Comment
- Repost
- Share
Silver surged with high volume yesterday and then experienced a significant fluctuation. The disagreement at this level is too great. I choose to take profits and reduce leverage. Let's observe in the short term.
View Original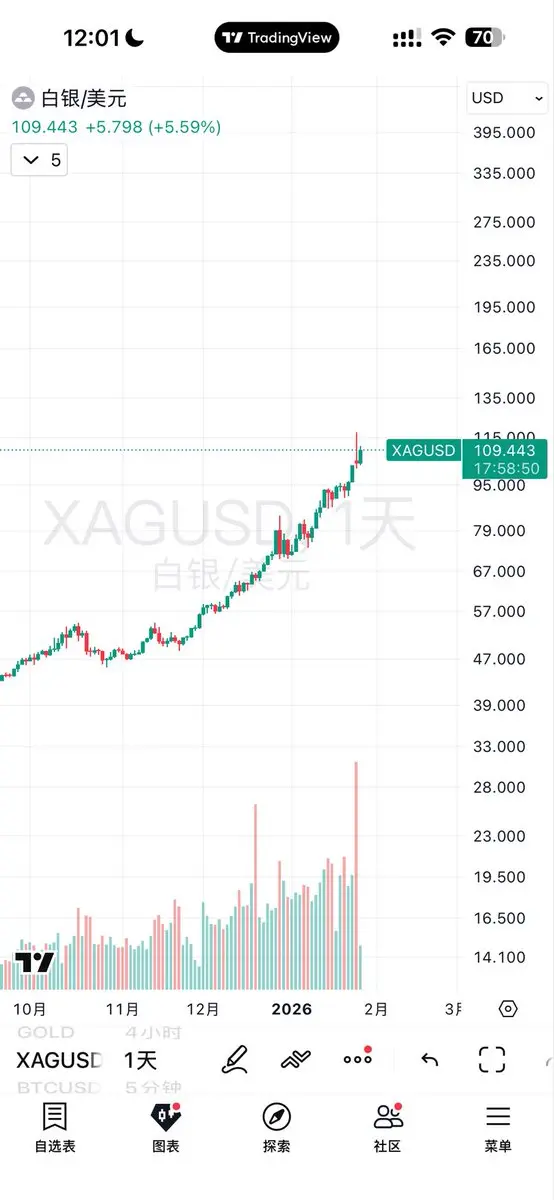
- Reward
- like
- Comment
- Repost
- Share
ETH/USDT 1-Hour K-Line Analysis: Rebound Momentum Strengthens, Short-term Bulls Dominate
Key Support and Resistance Levels
• Resistance Levels
1. First Resistance: 2,966.87 (Previous High), a critical short-term resistance level for the rebound. Breaking through could lead to a test of the 3,000 psychological barrier.
2. Second Resistance: 3,000 round number, an important psychological resistance. A breakout would open further upside space.
3. Third Resistance: 3,011.49 (Recent High), confirmation of a medium-term rebound trend requires a breakout.
• Support Levels
1. First Support: 2,936.48 (
ETH2,39%

- Reward
- like
- Comment
- Repost
- Share
From a short-term technical perspective, Bitcoin has been trading within a narrow range of $88,000 to $89,000 over the past two days, and this zone is very critical. It was previously a strong support level but has now become the main battleground between bulls and bears. On the four-hour chart, the price has repeatedly tested the middle Bollinger Band at $88,500 but faced resistance and pulled back. The rebound volume is clearly insufficient. After spiking to $88,828 yesterday, it quickly retreated, indicating typical weak buying pressure. Currently, the overall structure remains a weak oscil
BTC0,74%
- Reward
- 4
- 2
- Repost
- Share
GateUser-f8a76bea:
solid result gasssssssssssssView More
Do you remember when you joined X? I do! #MyXAnniversary

- Reward
- like
- Comment
- Repost
- Share
🚀 Content Mining Revamp — Public Beta Is Live!
We’re excited to announce the launch of the Content Mining Revamp Public Beta, a major upgrade designed to empower creators, analysts, and community builders in the Web3 ecosystem.
This revamp introduces a more transparent reward structure, improved content evaluation mechanisms, and enhanced performance tracking to ensure high-quality contributions are recognized and fairly rewarded. With optimized workflows and smarter incentive alignment, participants can now turn valuable insights into sustainable rewards more efficiently than ever before.
Th


- Reward
- 5
- 6
- Repost
- Share
MoonGirl:
Happy New Year! 🤑View More
- Reward
- like
- Comment
- Repost
- Share
Load More
Join 40M users in our growing community
⚡️ Join 40M users in the crypto craze discussion
💬 Engage with your favorite top creators
👍 See what interests you
Trending Topics
View More31.74K Popularity
106.1K Popularity
74.21K Popularity
21.14K Popularity
41.27K Popularity
News
View MoreData: 136.42 BTC transferred from an anonymous address, then routed through a relay to another anonymous address
5 m
"Victory War God" today shorted BTC 9 times without a single loss, totaling a profit of $19,000.
11 m
Ostium launches Uranium (Uranium) perpetual contracts
17 m
Gate ETF has launched ACN3L/3S (Accenture), JPM3L/3S (JPMorgan Chase), and BABA3L/3S (Alibaba)
18 m
BTC's largest short "Air Force Commander" position was liquidated, suffering a $120 million setback, marking the largest liquidation address across the entire network in the past 24 hours.
18 m
Pin