Monthly Outlook: Debunking the Seasonality Myth
Summary
We believe that the crypto bull market has room to run in early 4Q25, driven by a resilient liquidity and macro backdrop as well as supportive regulatory dynamics. In our view, bitcoin in particular can continue to outperform market expectations as it benefits directly from existing macro tailwinds. That is, barring a shock to energy prices (or other factors that could negatively affect the inflation trend) we think the immediate risk to disrupting the current US monetary policy path is actually quite low. Meanwhile, technical demand from digital asset treasuries (DATs) should keep crypto markets well-supported.
However, the seasonality question continues to haunt the crypto space, as historically, bitcoin has experienced six consecutive declines against USD in September between 2017 and 2022. While this trend leads many investors to believe that seasonality significantly impacts crypto performance, this assumption would have been incorrect in 2023 and 2024. In fact, our study suggests that the small sample size and the wide range of possible outcomes limits the statistical significance of such seasonal indicators.
A more salient question for crypto markets is whether we are early or late in the DAT cycle. Public DATs hold over 1M BTC ($110B), 4.9M ETH ($21.3B) and 8.9M SOL ($1.8B) as of September 10, while late entrants have started to target altcoins further down the risk curve. We believe that we’re currently in the player-versus-player (PvP) phase of the cycle, which can continue to drive capital into the large cap crypto names. However, this is also more than likely a precursor to consolidation among the smaller DAT players.
Outlook still constructive
At the start of the year, we argued that crypto markets would find their low in 1H25 and make new all time highs in 2H25. This was an out-of-consensus view at the time, as market participants expressed apprehension regarding a potential recession, questioned whether upward price movements signified a market melt-up, and pondered the duration of any recoveries. However, we found those viewpoints to be misguided and instead anchored on our divergent macro outlook.
Heading into Q4, we maintain a constructive outlook on crypto markets, anticipating continued support from robust liquidity, a favorable macroeconomic environment, and encouraging regulatory developments. On monetary policy, we expect that the Federal Reserve will deliver rate cuts on both September 17 and October 29, as the US labor market has provided strong evidence of weakness. Rather than signifying a local top, we think this will unlock cash sitting on the sidelines. Indeed, we argued in August that lower interest rates could lead a significant portion of the $7.4T sitting in money market funds to come off the sidelines.
That said, a significant shift in the current inflation trajectory would pose risks to this outlook, if for example, energy prices picked up. (Note: we think tariffs actually represent a far lower risk than some give it credit for.) However, OPEC+ recently agreed to increase oil output again, while oil demand is showing signs of slowing globally. That said, prices could also be affected higher by the prospect of more sanctions on Russia. For now, we don’t expect prices to cross the thresholds that would tip the economic scenario into stagflation territory.
You can’t tell me what to do, you’re not my real DAT
Separately, we believe that technical demand from digital asset treasuries (DATs) is expected to provide ongoing support for crypto markets. Indeed, the DAT phenomenon has reached a critical inflection point. We are no longer in the early adoption phase that characterized the last 6-9 months, but neither do we think we’re close to the end. Rather, we’ve entered what we would call the player-versus-player (PvP) stage — a competitive phase where success depends increasingly on execution, differentiation, and timing rather than simply copying the MicroStrategy playbook.
Indeed, early movers like MicroStrategy enjoyed substantial premiums to their net asset value (NAV), but competition, execution risks and regulatory constraints have contributed to mNAV compression. The scarcity premium that benefited early adopters has already dissipated, in our view. Still, bitcoin-dedicated DATs now hold over 1M BTC, representing approximately 5% of the token’s circulating supply. Similarly, the top ETH-dedicated DATs collectively own around 4.9M ETH ($21.3B) representing over 4% of the total ETH circulating supply.
Chart 1. ETH DATs have continued to ramp up their purchases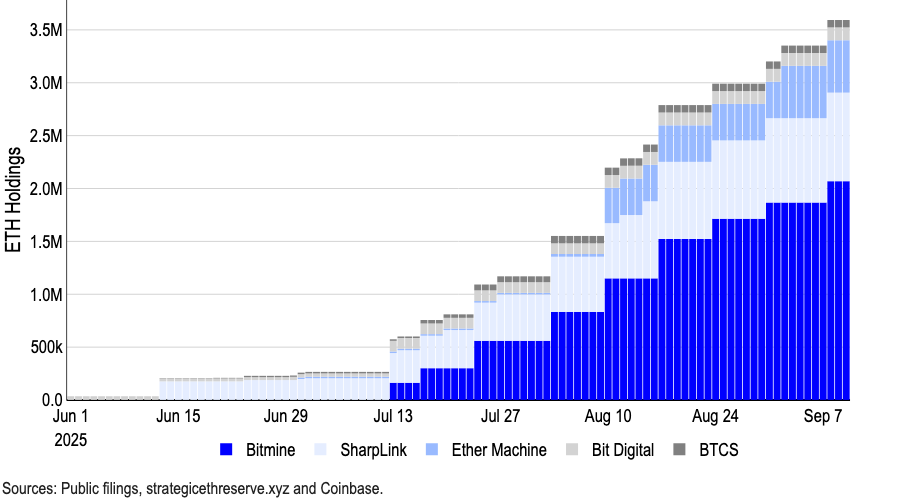
In August, the Financial Times reported that 154 US-listed companies have raised around $98.4B for crypto purchases in 2025, up dramatically from just $33.6B raised by 10 companies prior to this year (based on Architect Partners data.) The capital commitment for other tokens is also growing, particularly for SOL and other altcoins. (Forward Industries recently raised $1.65B to fund a SOL-based DAT backed by Galaxy Digital, Jump Crypto, and Multicoin Capital.)
That growth has drawn increased scrutiny. Indeed, recent reports indicate that Nasdaq is tightening its supervision of DATs, requiring shareholder approval for certain transactions and advocating for enhanced disclosures. That said, Nasdaq clarified that they have not issued any formal press release about new rules specifically for DATs.
For now, we think the DAT cycle is maturing, but it’s neither early or late. Certainly, the days of easy money and guaranteed mNAV premiums are over, in our view, as in this PvP stage, only the most disciplined and strategically positioned players will thrive. We expect crypto markets will continue to benefit from the unprecedented capital flowing from these vehicles to supercharge returns.
At the peril of seasonality?
Meanwhile, the question of seasonality continues to occupy the minds of market players in the crypto space. Bitcoin declined against USD in six consecutive Septembers between 2017 and 2022, with an average negative return of 3% over the last ten years. This gives many investors the impression that seasonality heavily influences crypto performance and that September tends to be a bad time to hold risk. Yet, if you were to trade on this assumption, you would have been wrong in both 2023 and 2024.
Indeed, we don’t think monthly seasonality is a particularly useful trading signal for bitcoin. Across frequency plots, logistic odds ratios, out of sample scoring, placebo checks, and controls, the message is the same: month-of-year isn’t a statistically dependable predictor of whether monthly log returns will be positive or negative for BTC. (Note: we use log returns to measure geometric or compounded growth because this better reflects long-term trends and accounts for bitcoin’s higher volatility.)
Chart 2. Monthly BTC log returns heatmap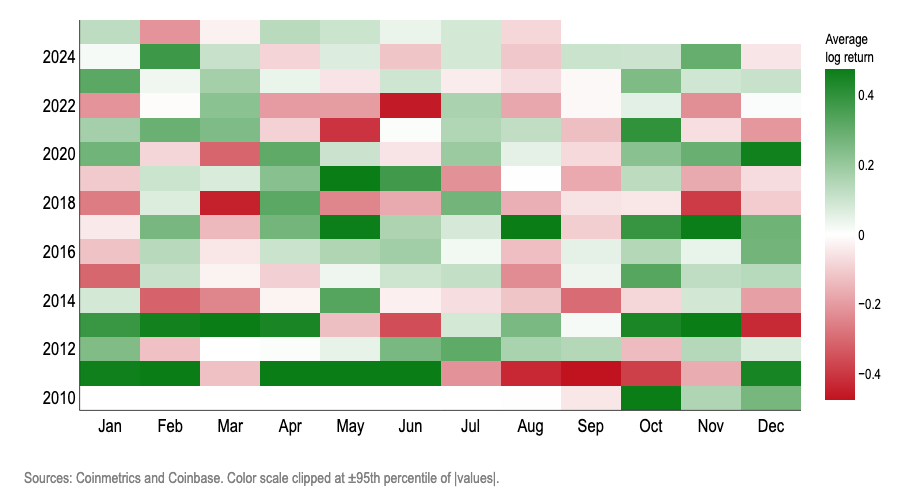
The following tests find “calendar month” unreliable for predicting the sign of monthly bitcoin log returns:
1.Wilson confidence intervals: Chart 3 shows that after accounting for small-sample uncertainty, no month clears a major significance hurdle predicting seasonality. The months that look “high” (Feb/Oct) or “low” (Aug/Sep) have error bars that overlap the overall average and each other, which demonstrates random variance rather than a durable calendar effect.
- Each dot shows the share of times BTC finished that month with a gain; the vertical lines/bars represent 95% Wilson confidence interval bands, which is the appropriate metric when each month only has ~12-13 data points because they yield more accurate uncertainty thresholds for small samples.
- The dashed line shows the overall average up-rate. Because we’re looking across 12 months at once, we apply the Holm multiple-testing adjustment so one lucky month doesn’t masquerade as a pattern.
Chart 3. Positive log returns rate for BTC with 95% Wilson confidence intervals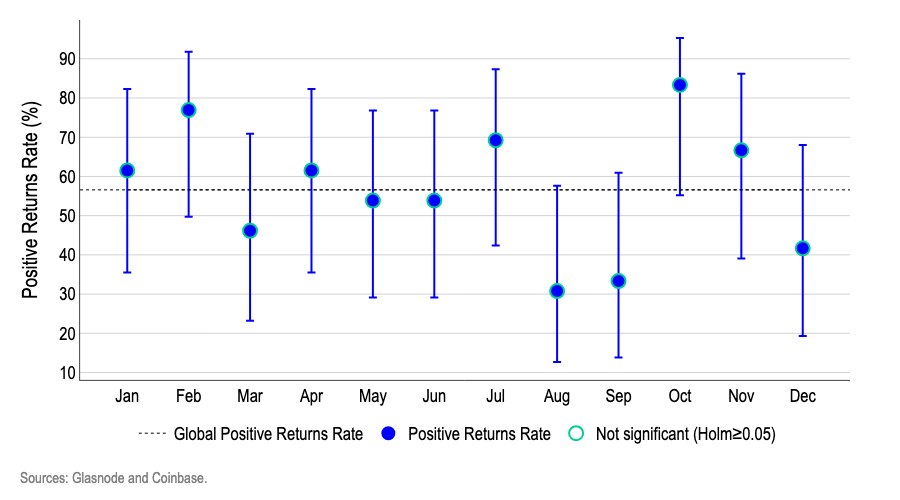
2.Logistic regression: We used a logistic regression model to see whether certain months were better or worse for bitcoin’s odds of an up/down month versus January as the baseline. Chart 4 shows the odds ratios for individual months mostly sit near 1.0 and crucially, their 95% confidence bands cross 1.0.
- Numbers around 1.0 mean “same odds of positive log returns as January,” numbers above 1.0 mean “higher odds,” and below 1.0 mean “lower odds.”
- For example, an odds ratio of 1.5 would mean roughly “about 50% higher odds of an up month than January,” while 0.7 would mean “about 30% lower.”
- Since most bands cross 1.0 and a Holm multiple-testing adjustment shows no month is significant, we cannot conclude that calendar month is a useful predictor for the sign of bitcoin log returns.
Chart 4. Logistic regression – odds of positive/negative monthly BTC log returns versus January (baseline)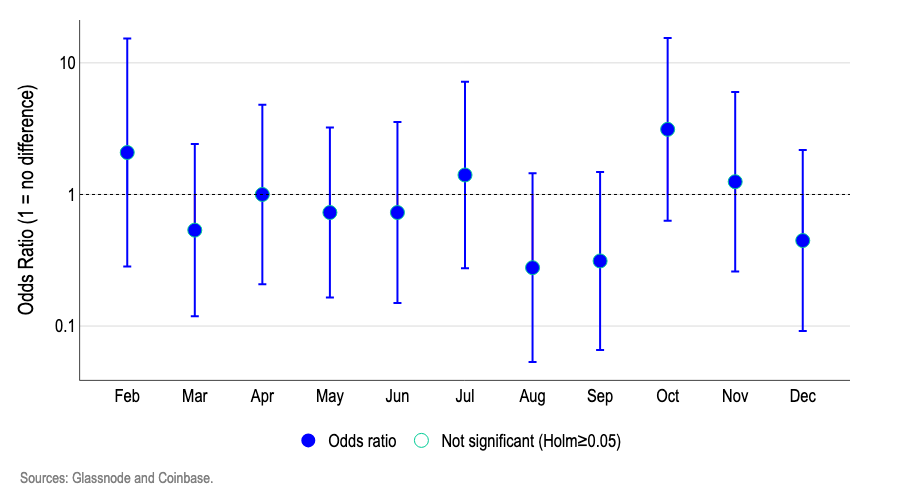
3.Out-of-sample predictions: At each step, we re-estimate two models using only data available up to that month, after initially using half the dataset for training:
- The baseline is an intercept-only logistic model, which simply predicts a constant probability equal to the historical share of positive return months so far (the base-rate).
- The month-of-year (MoY) model is a logistic regression with month dummies; it predicts the probability of an up month for the current calendar month based on how that month has behaved in the past.
Our results are presented in Chart 5, where (1) the x-axis represents the predicted probability of a positive log returns month and (2) the y-axis represents the fraction of months that finished positive. When charting predictions, a perfectly calibrated model would have points lined up against the 45° line, such that (for example) predicting 50% odds of an “up month” would result in 50% up months.
The month-of-year (MoY) model deviates significantly. For example:
- when it predicted around 27% odds of an up month, the realized frequency was about 50% (too pessimistic);
- for around 45–60% predictions it was only roughly on target;
- at the high end it was over-confident—e.g., ~75% predicted led to ~70% realized, and an extreme bucket predicted ~85% yet realized ~0%.
By contrast, the benchmark that always predicts the historical base-rate—about 55–57% odds of an up month—lands near the 45° line and barely moves given the relatively constant probability of bitcoin having a positive month over time. Simply put, this outcome suggests that calendar month has little forecasting ability out of sample.
Chart 5: Out of sample prediction accuracy of month-of-year (MoY) logistic regression model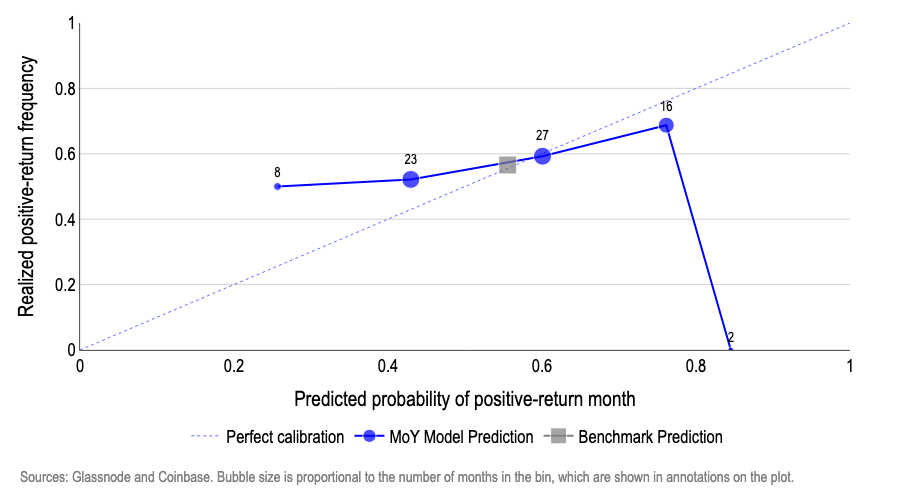
4.Placebo shuffles: To test whether “month labels” help call positive vs negative log returns, we fit a simple logistic model with month dummies and asked, as a group, whether those dummies improve fit over a no-month baseline (a standard likelihood-ratio joint test). We obtain an observed p-value of 0.15, which means that even if months are irrelevant, a pattern at least this strong shows up about 15% of the time by chance. Then we randomly reshuffled the month labels thousands of times and re-ran the same joint test each time.
- As a result, we find about 19% of those random shuffles produced a p-value as small or smaller than the observed p-value (Chart 6).
- Put simply, the result is common under pure randomness, which reinforces the “no month signal” conclusion. For the month labels to be statistically meaningful, the real-data joint test should have a p-value < 0.05, and fewer than 5% of the shuffles should produce p-values that small.
Chart 6. Placebo p-values from shuffling “month” labels in logistic model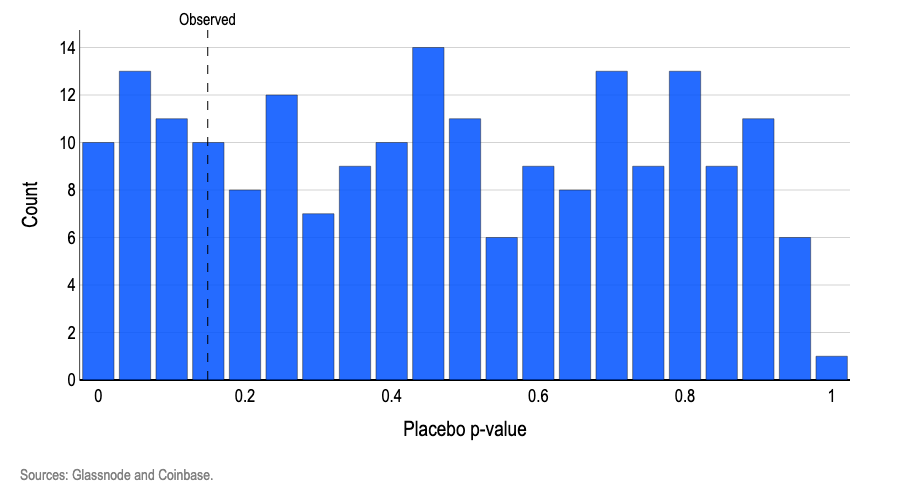
5.Controls: Adding real-world calendar flags does not unlock a tradable edge—and it usually makes sign prediction actually worse. We re-estimated the “odds of a positive month” with the same month-of-year dummies, then layered in practical controls for two major events that 1) may affect bitcoin log returns and 2) don’t fall on the same month every year: Lunar New Year and bitcoin-halving windows (±2 months). We only use controls that fall on different calendar months each year to avoid redundant dummy variables that would otherwise make the model estimates unstable.
The point of this test is to check two common concerns: (i) maybe what looks like a “month effect” is really just recurring events in disguise – e.g. Lunar New Year (LNY) liquidity or bitcoin-halving effects; and (ii) even if the raw month pattern is weak, perhaps it becomes useful once you account for these drivers. Initially, we use half the dataset as training and half for testing. We graded each month’s probability forecast with the Brier score, which reflects the average squared error between the forecasted probability and the actual positive/negative outcome (i.e. how far off the predictions were from reality.)
In Chart 7, the bars show Brier improvement versus a simple baseline that uses just one number: the historical up-month rate from the training window. Every bar is below zero, which means every control variant did worse than the constant-probability baseline. Simply put, the introduction of additional calendar flags on top of monthly labels only added noise.
Chart 7: Brier improvement scores for out of sample forecasts using a logistic model with added controls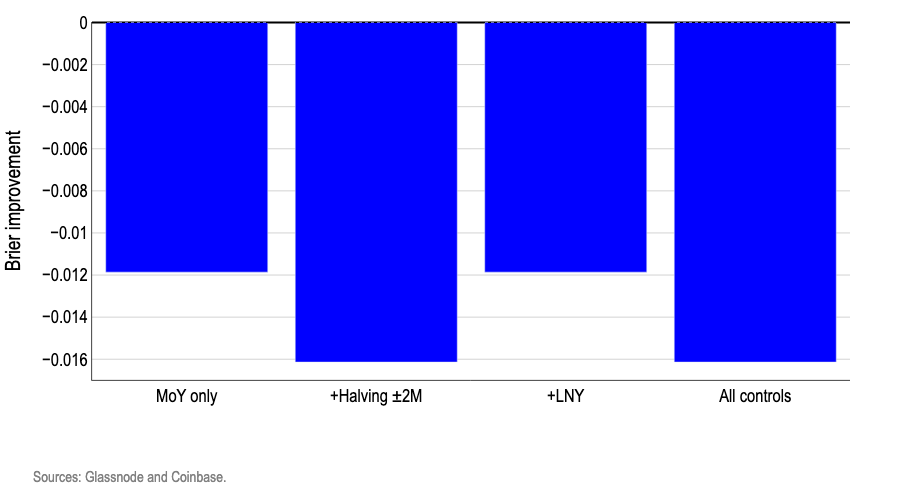
Conclusions
The idea of seasonality in markets has a pernicious hold on investors’ minds that can potentially be self-realizing. However, our models suggest that just assuming each month has roughly the same odds as the long-term historical average beats all calendar-based approaches to trading. This strongly suggests that calendar patterns don’t contain truly useful information for predicting bitcoin’s monthly direction. Since the calendar month is not a reliable predictor of whether log returns will be positive or negative, it is highly improbable that it could predict the magnitude of any log returns either. The coincident declines in previous Septembers and even the increases linked to bitcoin’s “Uptober” lore may be statistically interesting, but not statistically significant.
Disclaimer:
- This article is reprinted from [coinbase]. All copyrights belong to the original author [David Duong, CFA - Global Head of Research, Colin Basco - Research Associate]. If there are objections to this reprint, please contact the Gate Learn team, and they will handle it promptly.
- Liability Disclaimer: The views and opinions expressed in this article are solely those of the author and do not constitute any investment advice.
- Translations of the article into other languages are done by the Gate Learn team. Unless mentioned, copying, distributing, or plagiarizing the translated articles is prohibited.
Share
Content


Related Articles

The Future of Cross-Chain Bridges: Full-Chain Interoperability Becomes Inevitable, Liquidity Bridges Will Decline

Solana Need L2s And Appchains?

Sui: How are users leveraging its speed, security, & scalability?

Navigating the Zero Knowledge Landscape

What is Tronscan and How Can You Use it in 2025?
