SYNT vs DOT: Comparing Two Innovative Blockchain Protocols for Scalability and Interoperability
Introduction: SYNT vs DOT Investment Comparison
In the cryptocurrency market, the comparison between Synternet (SYNT) and Polkadot (DOT) has been an unavoidable topic for investors. The two not only show significant differences in market cap ranking, application scenarios, and price performance but also represent different positioning in the crypto asset space.
Synternet (SYNT): Launched as a blockchain that powers modular, interoperable data infrastructure across all major chains.
Polkadot (DOT): Introduced in 2020, it has been hailed as a next-generation blockchain protocol that connects multiple specialized blockchains into a unified network.
This article will comprehensively analyze the investment value comparison between SYNT and DOT, focusing on historical price trends, supply mechanisms, institutional adoption, technological ecosystems, and future predictions, attempting to answer the question most concerning to investors:
"Which is the better buy right now?"
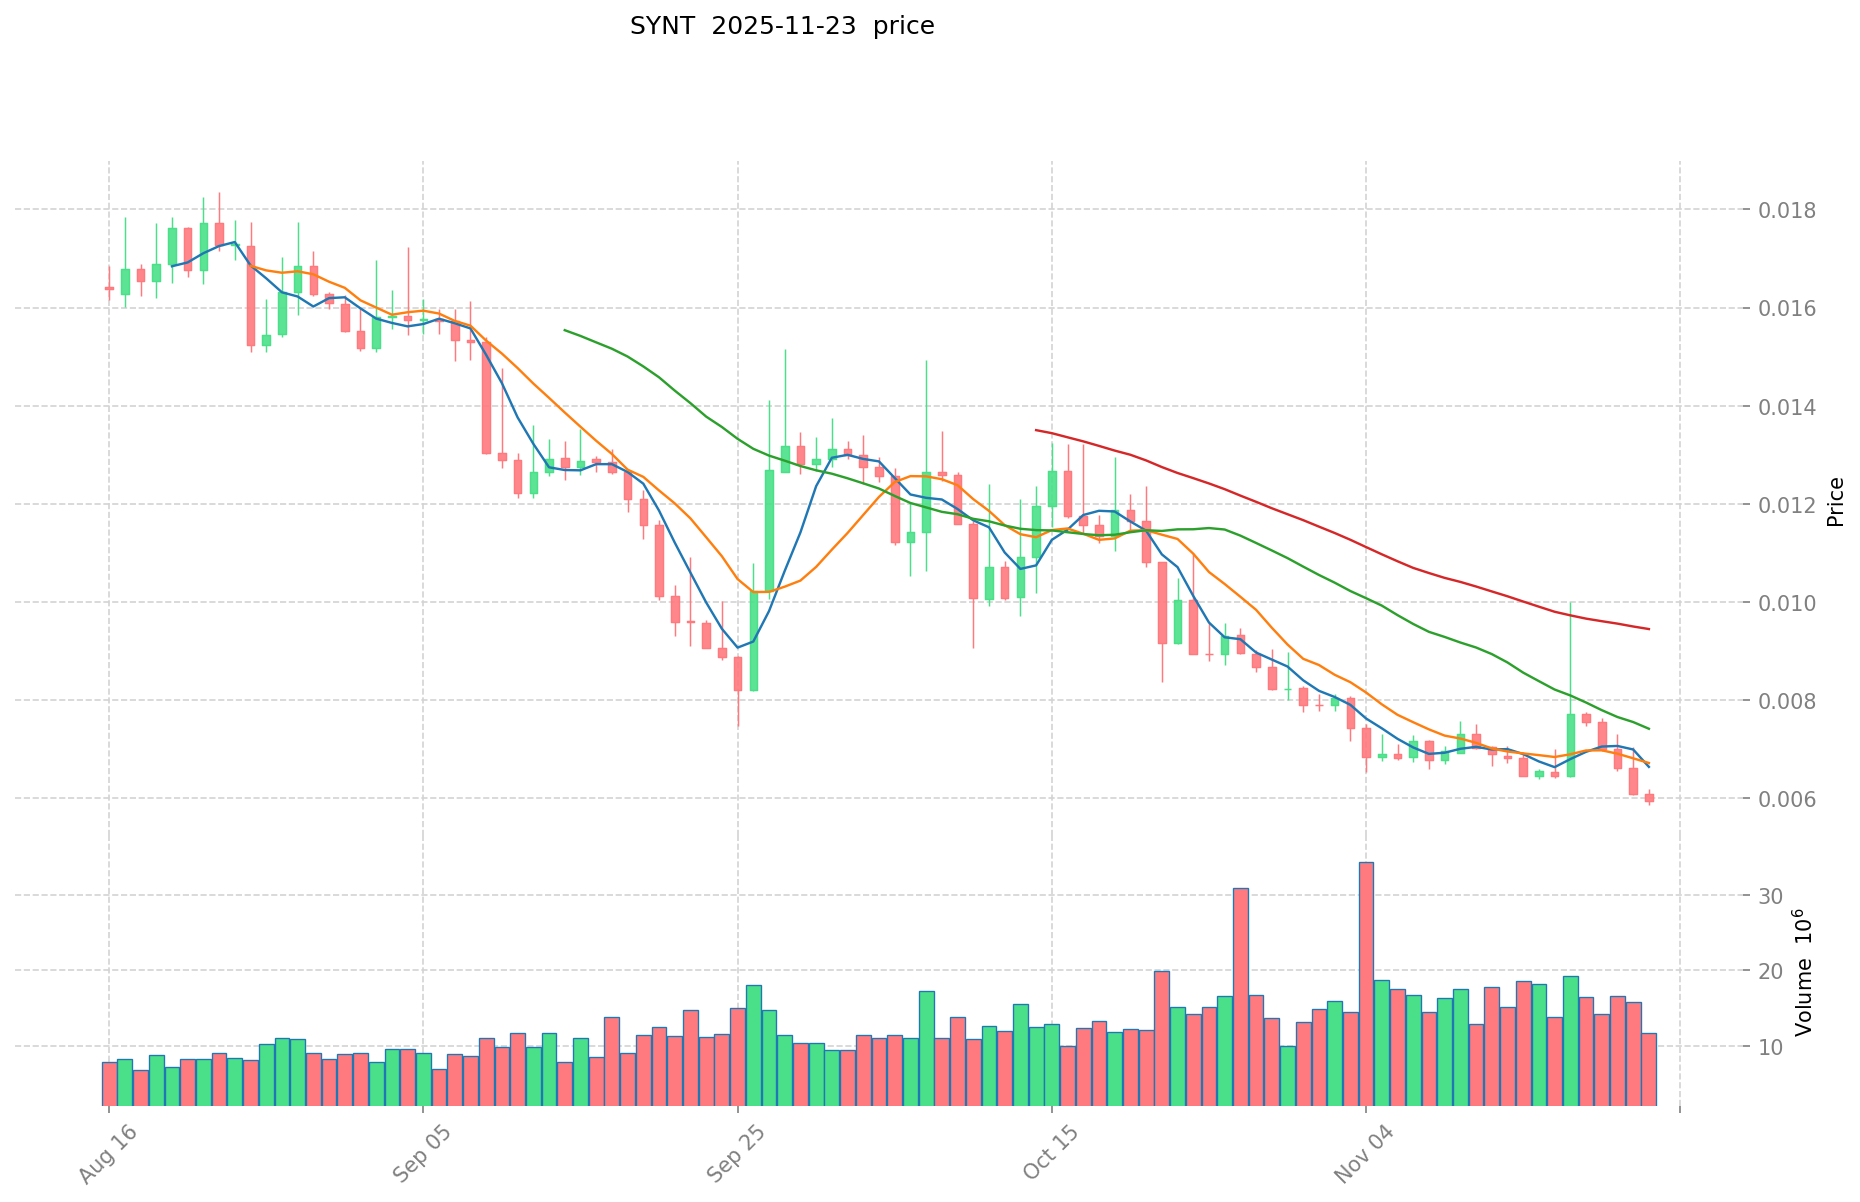
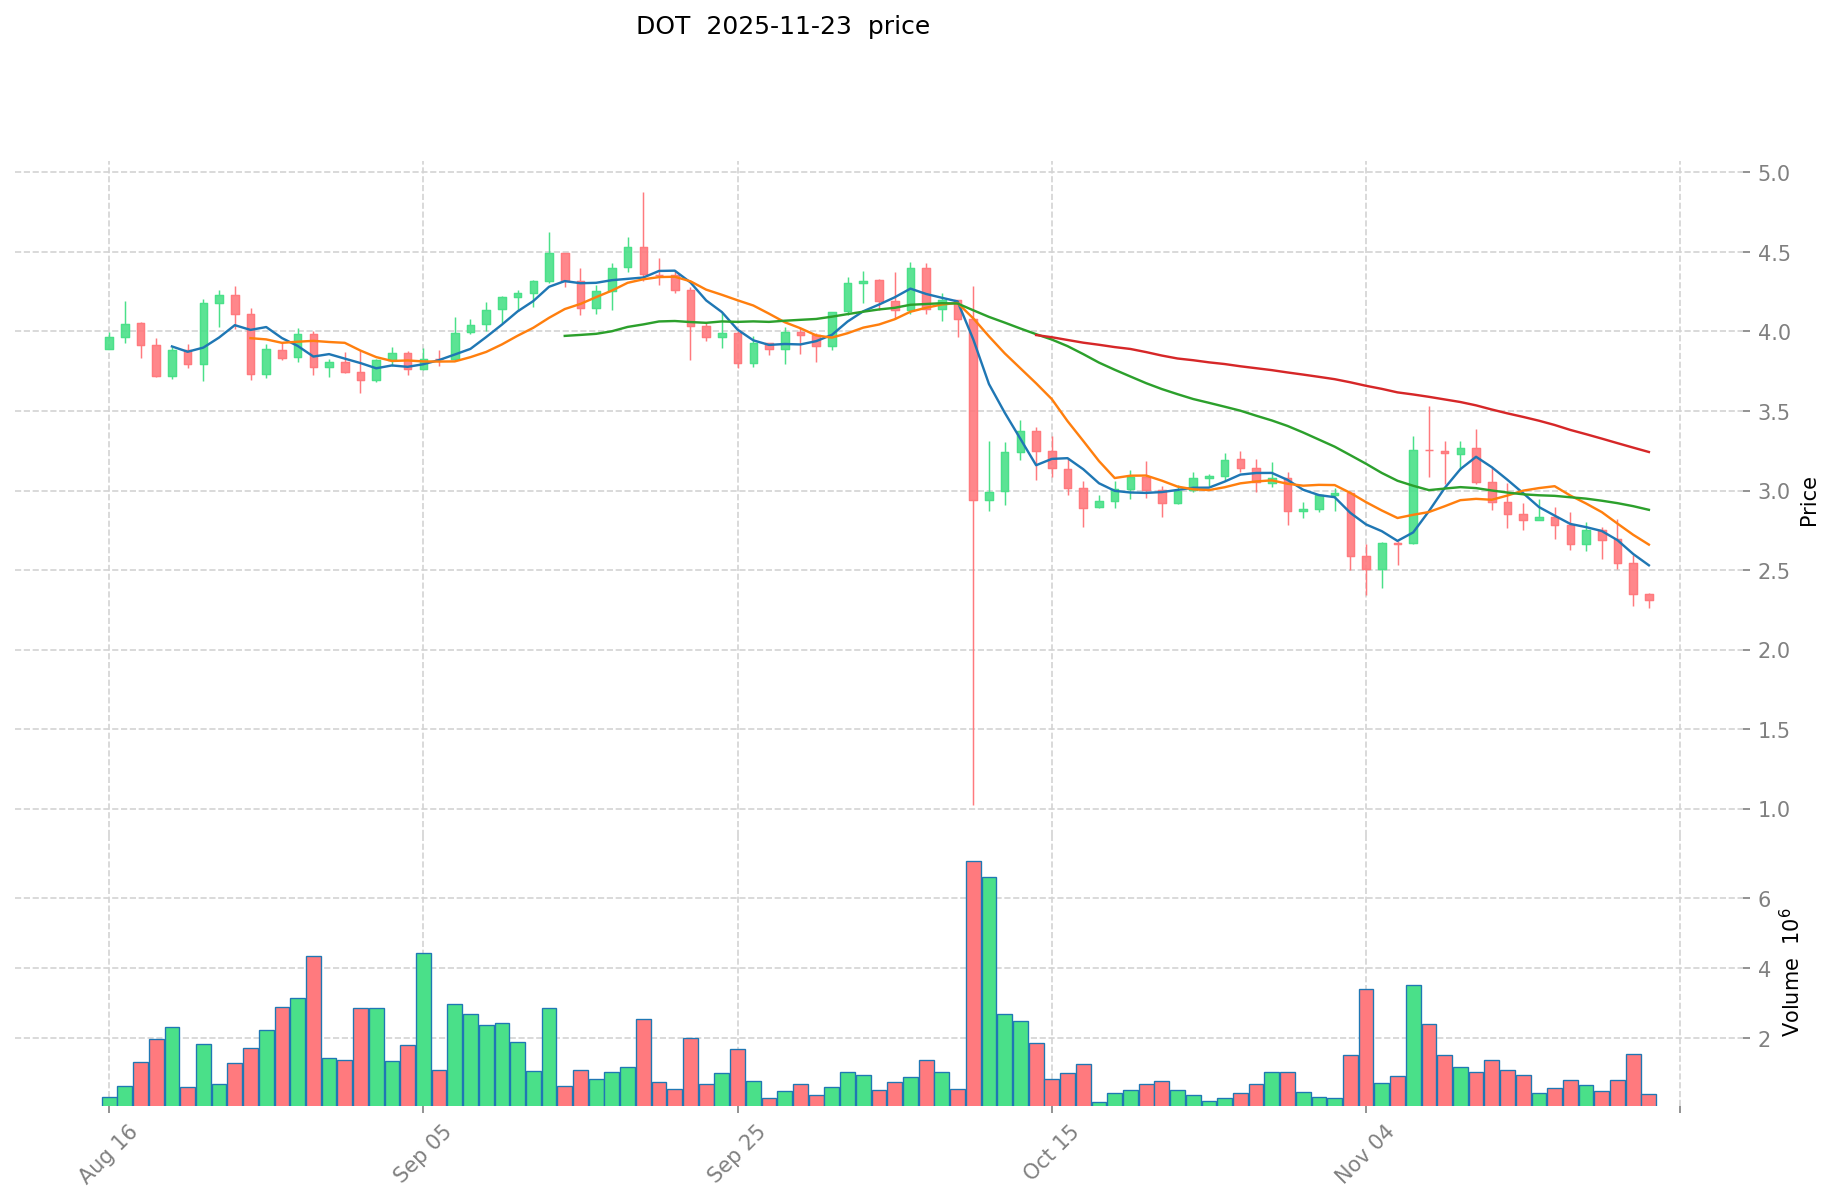
I. Price History Comparison and Current Market Status
SYNT (Coin A) and DOT (Coin B) Historical Price Trends
- 2024: SYNT reached its all-time high of $0.09812 on July 25, 2024.
- 2025: DOT experienced a significant decline, reaching its all-time low of $2.13 on October 11, 2025.
- Comparative analysis: In the current market cycle, SYNT has fallen from its high of $0.09812 to a low of $0.00586, while DOT has dropped from its all-time high of $54.98 to its current price of $2.349.
Current Market Situation (2025-11-23)
- SYNT current price: $0.006
- DOT current price: $2.349
- 24-hour trading volume: SYNT $72,520.49 vs DOT $839,770.28
- Market Sentiment Index (Fear & Greed Index): 13 (Extreme Fear)
Click to view real-time prices:
- View SYNT current price Market Price
- View DOT current price Market Price
II. Core Factors Affecting Investment Value of SYNT vs DOT
Supply Mechanism Comparison (Tokenomics)
- SYNT: Fixed supply model with a maximum cap, creating potential scarcity value
- DOT: Inflationary model with staking rewards, with inflation rate determined by staking participation
- 📌 Historical Pattern: Fixed supply tokens tend to show higher volatility in bull markets, while inflationary tokens with staking may provide more price stability during market downturns.
Institutional Adoption and Market Applications
- Institutional Holdings: DOT has attracted more institutional interest through parachain auctions and development funds
- Enterprise Adoption: DOT has stronger enterprise applications through its interoperability framework, while SYNT remains more speculative
- National Policies: Regulatory frameworks for both remain uncertain, with DOT's governance model potentially offering more regulatory clarity
Technical Development and Ecosystem Building
- DOT Technical Upgrades: Parachain auctions, cross-chain messaging, and interoperability solutions provide strong technical foundation
- SYNT Technical Development: Focused on synthetic asset development and derivatives infrastructure
- Ecosystem Comparison: DOT has a more mature ecosystem with multiple parachains, while SYNT is working to establish its DeFi primitives
Macroeconomic Factors and Market Cycles
- Performance in Inflationary Environment: DOT's utility-focused model may provide better inflation resistance
- Macroeconomic Monetary Policy: Interest rate hikes have historically impacted both assets, with DOT showing more resilience
- Geopolitical Factors: DOT's decentralized governance model positions it better for cross-border adoption in varied jurisdictional environments III. 2025-2030 Price Prediction: SYNT vs DOT
Short-term Prediction (2025)
- SYNT: Conservative $0.004073 - $0.00599 | Optimistic $0.00599 - $0.008386
- DOT: Conservative $1.81104 - $2.352 | Optimistic $2.352 - $3.0576
Mid-term Prediction (2027)
- SYNT may enter a growth phase, with an estimated price range of $0.00488 - $0.00799
- DOT may enter a bullish market, with an estimated price range of $1.898 - $3.322
- Key drivers: Institutional capital inflow, ETF, ecosystem development
Long-term Prediction (2030)
- SYNT: Base scenario $0.00635 - $0.00993 | Optimistic scenario $0.00993 - $0.01341
- DOT: Base scenario $2.765 - $3.950 | Optimistic scenario $3.950 - $4.464
Disclaimer: The information provided is for informational purposes only and should not be considered as financial advice. Cryptocurrency markets are highly volatile and unpredictable. Always conduct your own research before making any investment decisions.
SYNT:
| 年份 | 预测最高价 | 预测平均价格 | 预测最低价 | 涨跌幅 |
|---|---|---|---|---|
| 2025 | 0.008386 | 0.00599 | 0.0040732 | 0 |
| 2026 | 0.00761928 | 0.007188 | 0.00373776 | 19 |
| 2027 | 0.0079959312 | 0.00740364 | 0.0048864024 | 23 |
| 2028 | 0.008931751296 | 0.0076997856 | 0.004388877792 | 28 |
| 2029 | 0.01155891814272 | 0.008315768448 | 0.00590419559808 | 38 |
| 2030 | 0.013415413448736 | 0.00993734329536 | 0.00635989970903 | 65 |
DOT:
| 年份 | 预测最高价 | 预测平均价格 | 预测最低价 | 涨跌幅 |
|---|---|---|---|---|
| 2025 | 3.0576 | 2.352 | 1.81104 | 0 |
| 2026 | 3.624432 | 2.7048 | 1.676976 | 14 |
| 2027 | 3.3228468 | 3.164616 | 1.8987696 | 34 |
| 2028 | 4.54122396 | 3.2437314 | 2.27061198 | 37 |
| 2029 | 4.0092520104 | 3.89247768 | 3.2307564744 | 65 |
| 2030 | 4.464477275076 | 3.9508648452 | 2.76560539164 | 67 |
IV. Investment Strategy Comparison: SYNT vs DOT
Long-term vs Short-term Investment Strategy
- SYNT: Suitable for investors focused on DeFi and synthetic asset potential
- DOT: Suitable for investors seeking ecosystem growth and interoperability solutions
Risk Management and Asset Allocation
- Conservative investors: SYNT: 20% vs DOT: 80%
- Aggressive investors: SYNT: 40% vs DOT: 60%
- Hedging tools: Stablecoin allocation, options, cross-currency portfolios
V. Potential Risk Comparison
Market Risk
- SYNT: Higher volatility due to lower market cap and trading volume
- DOT: Exposure to broader crypto market trends and parachain ecosystem performance
Technical Risk
- SYNT: Scalability, network stability
- DOT: Parachain auction dynamics, cross-chain security
Regulatory Risk
- Global regulatory policies may impact both assets differently, with DOT potentially facing more scrutiny due to its larger ecosystem
VI. Conclusion: Which Is the Better Buy?
📌 Investment Value Summary:
- SYNT advantages: Potential for high growth in synthetic asset space, fixed supply model
- DOT advantages: Established ecosystem, interoperability solutions, institutional adoption
✅ Investment Advice:
- New investors: Consider a DOT-heavy portfolio with a small SYNT allocation for diversification
- Experienced investors: Balanced approach with both assets, adjusting based on risk tolerance
- Institutional investors: Focus on DOT for its established ecosystem and governance structure
⚠️ Risk Warning: Cryptocurrency markets are highly volatile. This article does not constitute investment advice. None
VII. FAQ
Q1: What are the main differences between SYNT and DOT? A: SYNT is a blockchain powering modular, interoperable data infrastructure across major chains, while DOT is a next-generation blockchain protocol connecting multiple specialized blockchains. SYNT has a fixed supply model, whereas DOT has an inflationary model with staking rewards.
Q2: Which cryptocurrency has shown better price performance recently? A: Based on the current market data, SYNT has shown more volatility, falling from its all-time high of $0.09812 to $0.006. DOT has been more stable, currently trading at $2.349 after falling from its all-time high of $54.98.
Q3: How do the supply mechanisms of SYNT and DOT differ? A: SYNT has a fixed supply model with a maximum cap, potentially creating scarcity value. DOT has an inflationary model with staking rewards, where the inflation rate is determined by staking participation.
Q4: Which cryptocurrency has better institutional adoption? A: DOT has attracted more institutional interest through parachain auctions and development funds. It also has stronger enterprise applications due to its interoperability framework.
Q5: What are the long-term price predictions for SYNT and DOT? A: For 2030, SYNT's base scenario predicts a range of $0.00635 - $0.00993, with an optimistic scenario of $0.00993 - $0.01341. DOT's base scenario for 2030 is $2.765 - $3.950, with an optimistic scenario of $3.950 - $4.464.
Q6: How should investors allocate their portfolio between SYNT and DOT? A: Conservative investors might consider allocating 20% to SYNT and 80% to DOT, while aggressive investors might opt for 40% SYNT and 60% DOT. The exact allocation should be based on individual risk tolerance and investment goals.
Q7: What are the main risks associated with investing in SYNT and DOT? A: SYNT faces higher volatility due to lower market cap and trading volume, as well as potential technical risks related to scalability and network stability. DOT is exposed to broader crypto market trends, parachain ecosystem performance, and potential regulatory scrutiny due to its larger ecosystem.
Share
Content

