SEAM vs QNT: A Comparative Analysis of Emerging Blockchain Technologies for Enterprise Solutions
Introduction: SEAM vs QNT Investment Comparison
In the cryptocurrency market, the comparison between Seamless Protocol (SEAM) and Quant (QNT) has been an unavoidable topic for investors. The two not only show significant differences in market cap ranking, application scenarios, and price performance but also represent different positions in the crypto asset landscape.
Seamless Protocol (SEAM): Since its launch, it has gained market recognition as the first native decentralized lending and borrowing protocol on Base, focusing on lower-collateral borrowing and improved user experience.
Quant (QNT): Introduced in 2018, it has been hailed as a technology provider enabling trusted digital interaction, recognized for solving interoperability through its global blockchain operating system, Overledger.
This article will comprehensively analyze the investment value comparison between SEAM and QNT, focusing on historical price trends, supply mechanisms, institutional adoption, technological ecosystems, and future predictions, attempting to answer the question investors care about most:
"Which is the better buy right now?"
I. Price History Comparison and Current Market Status
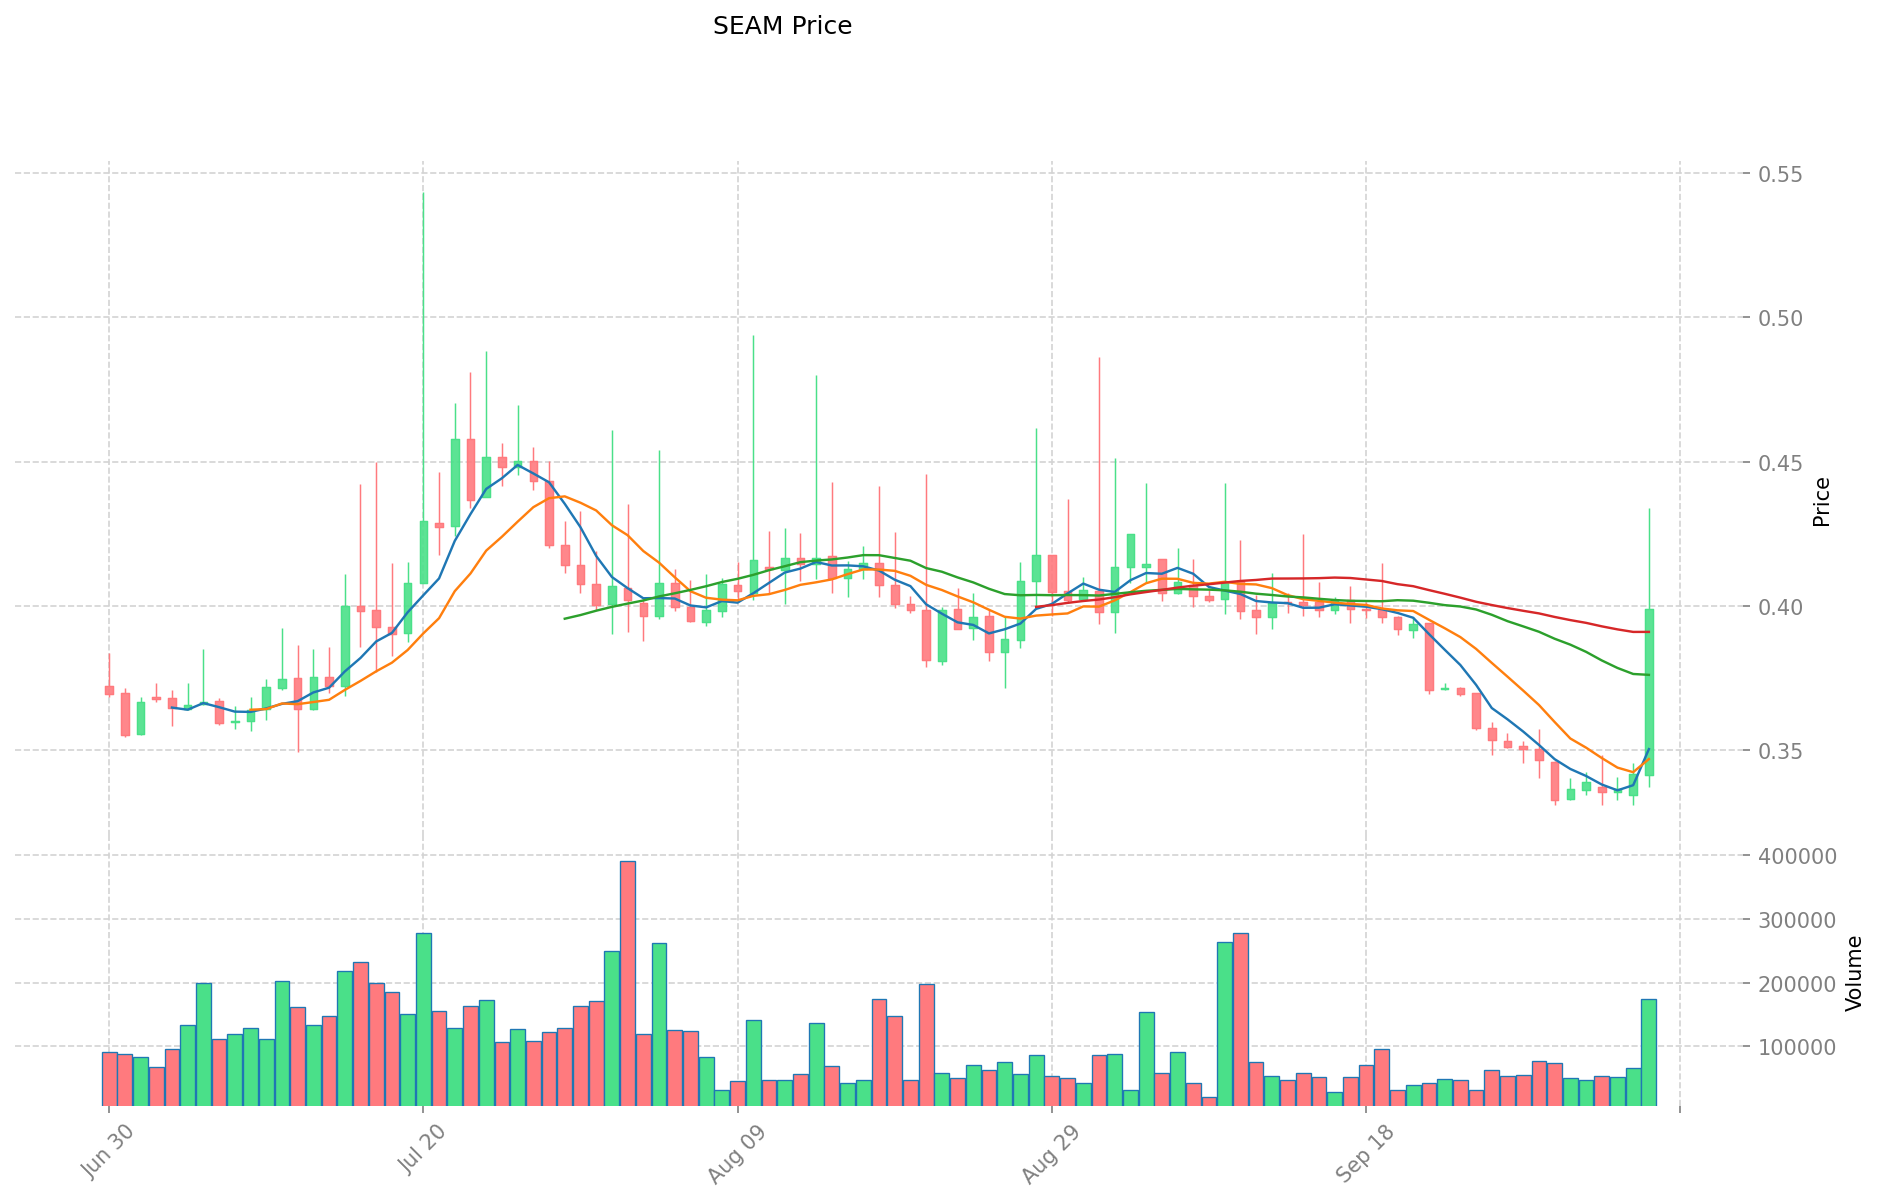
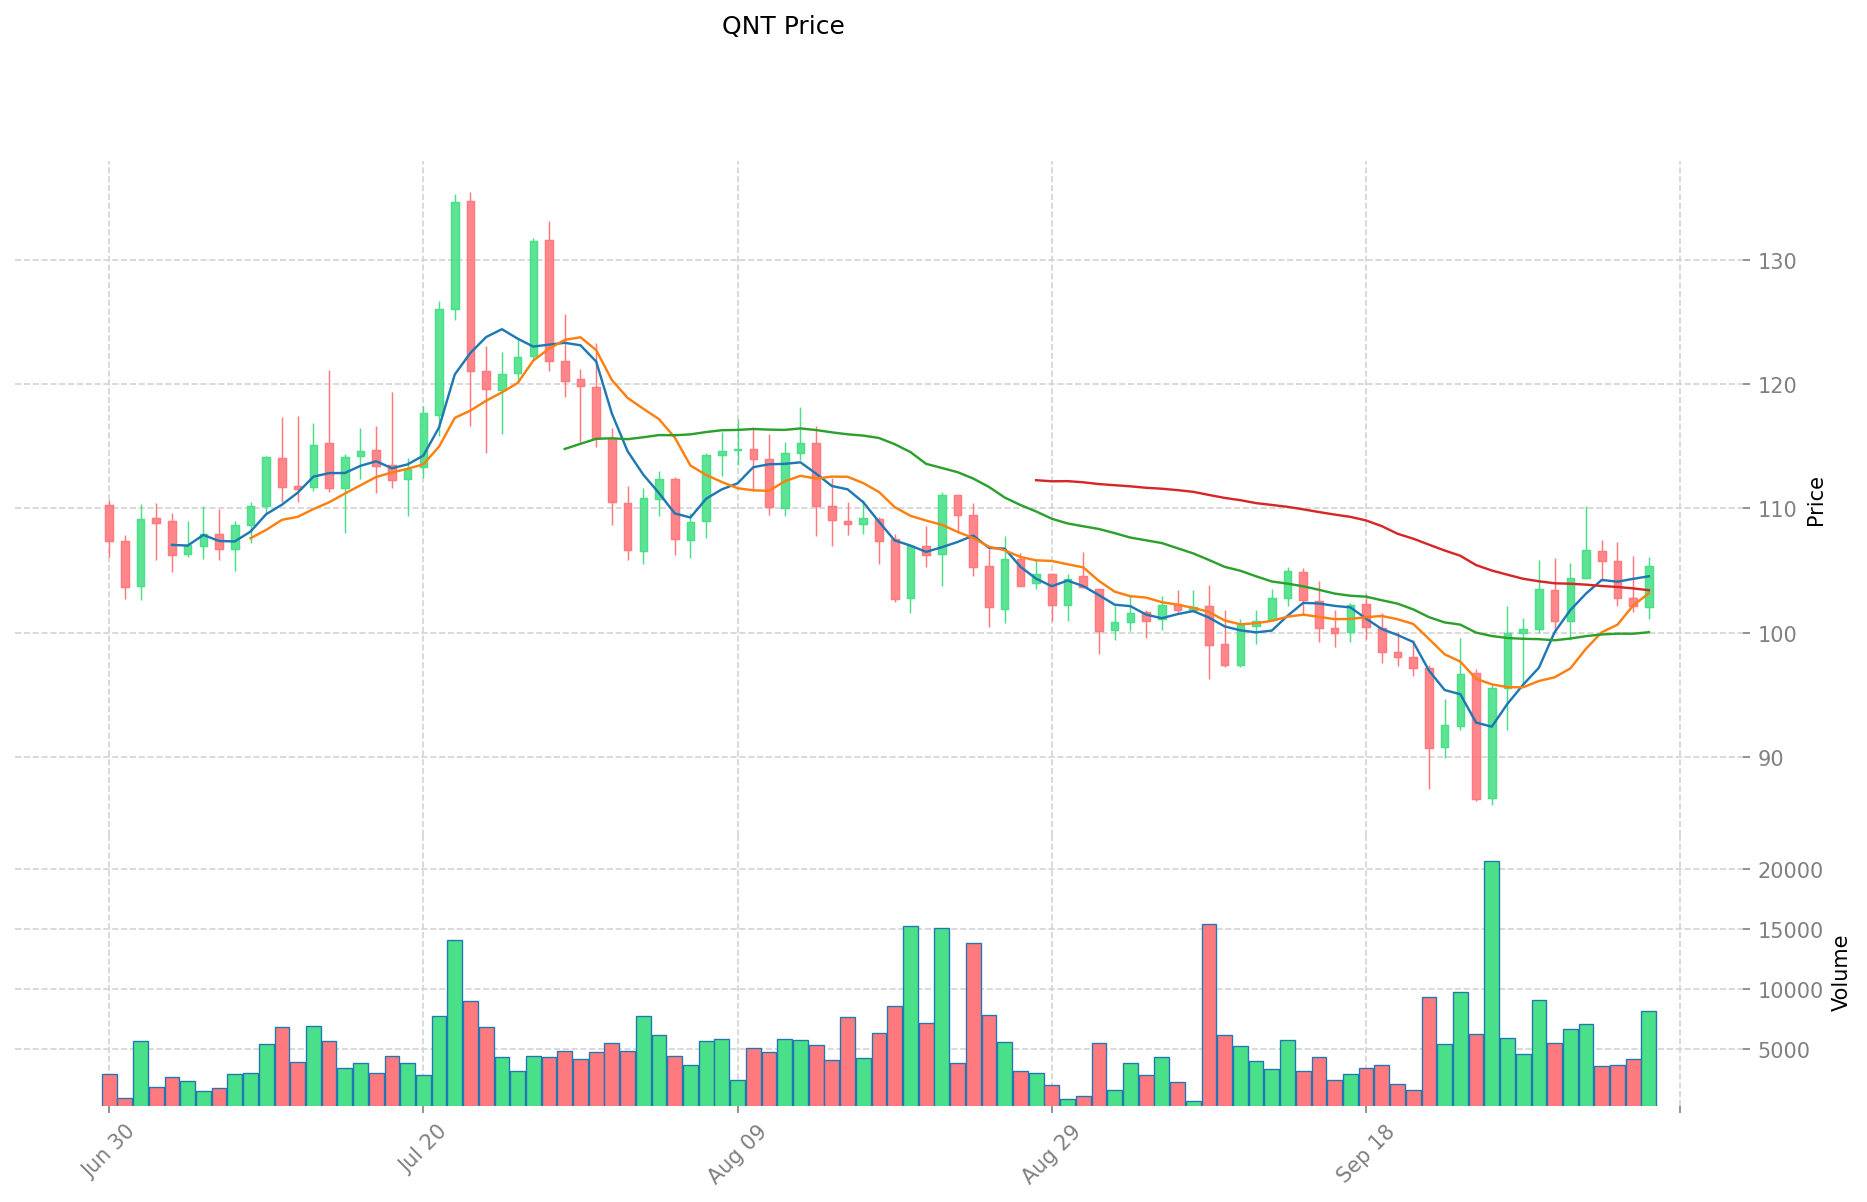
SEAM (Coin A) and QNT (Coin B) Historical Price Trends
- 2023: SEAM launched and reached its all-time high of $15.39 in December.
- 2021: QNT hit its all-time high of $427.42 in September during the bull market.
- Comparative analysis: In the recent market cycle, SEAM dropped from $15.39 to a low of $0.331, while QNT declined from $427.42 to current levels around $105.
Current Market Situation (2025-10-07)
- SEAM current price: $0.3987
- QNT current price: $105.57
- 24-hour trading volume: SEAM $68,126.60 vs QNT $848,430.29
- Market Sentiment Index (Fear & Greed Index): 71 (Greed)
Click to view real-time prices:
- View SEAM current price Market Price
- View QNT current price Market Price
II. Key Factors Affecting SEAM vs QNT Investment Value
Supply Mechanisms Comparison (Tokenomics)
- QNT: Limited supply model contributing to potential scarcity value
- SEAM: Supply mechanism details not specified in available data
- 📌 Historical Pattern: Supply constraints appear to influence market movements during volatility periods.
Institutional Adoption and Market Applications
- Institutional Holdings: Recent data shows significant whale activity with QNT, with a major holder transferring $3.42 million worth of QNT from Binance
- Enterprise Adoption: QNT demonstrates notable value in cross-border transactions based on whale activity
- Regulatory Attitudes: Thailand's SEC appears to be opening regulatory pathways that could impact crypto assets including altcoins
Technical Development and Ecosystem Building
- QNT Technical Development: Positioned as a significant altcoin with substantial transaction volumes
- SEAM Technical Development: Insufficient data available on current development status
- Ecosystem Comparison: Both tokens appear to be influenced by broader market trends in DeFi adoption
Macroeconomic Factors and Market Cycles
- Inflation Environment Performance: Both tokens experiencing price volatility in current market conditions
- Macroeconomic Monetary Policy: Crypto market showing significant growth potential, with ETH predictions of 2500% potential gains affecting the broader altcoin market
- Geopolitical Factors: Regional regulatory developments like Thailand's SEC policies potentially creating new investment channels for these assets
III. 2025-2030 Price Prediction: SEAM vs QNT
Short-term Prediction (2025)
- SEAM: Conservative $0.28 - $0.40 | Optimistic $0.40 - $0.42
- QNT: Conservative $92.75 - $105.40 | Optimistic $105.40 - $149.67
Mid-term Prediction (2027)
- SEAM may enter a growth phase, with estimated price range $0.35 - $0.72
- QNT may enter a bullish market, with estimated price range $112.48 - $185.91
- Key drivers: Institutional capital inflow, ETF, ecosystem development
Long-term Prediction (2030)
- SEAM: Base scenario $0.50 - $0.73 | Optimistic scenario $0.73 - $0.79
- QNT: Base scenario $188.39 - $254.58 | Optimistic scenario $254.58 - $374.24
Disclaimer: These predictions are based on historical data and current market trends. Cryptocurrency markets are highly volatile and subject to rapid changes. This information should not be considered as financial advice.
SEAM:
| 年份 | 预测最高价 | 预测平均价格 | 预测最低价 | 涨跌幅 |
|---|---|---|---|---|
| 2025 | 0.419685 | 0.3997 | 0.275793 | 0 |
| 2026 | 0.602247975 | 0.4096925 | 0.30317245 | 2 |
| 2027 | 0.71847773725 | 0.5059702375 | 0.35417916625 | 26 |
| 2028 | 0.78976894371375 | 0.612223987375 | 0.4285567911625 | 53 |
| 2029 | 0.757076182787925 | 0.700996465544375 | 0.511727419847393 | 75 |
| 2030 | 0.794649593341103 | 0.72903632416615 | 0.503035063674643 | 82 |
QNT:
| 年份 | 预测最高价 | 预测平均价格 | 预测最低价 | 涨跌幅 |
|---|---|---|---|---|
| 2025 | 149.668 | 105.4 | 92.752 | 0 |
| 2026 | 184.9243 | 127.534 | 94.37516 | 20 |
| 2027 | 185.9126885 | 156.22915 | 112.484988 | 47 |
| 2028 | 241.2099961425 | 171.07091925 | 162.5173732875 | 61 |
| 2029 | 303.0264728134875 | 206.14045769625 | 109.2544425790125 | 94 |
| 2030 | 374.237693924657062 | 254.58346525486875 | 188.391764288602875 | 140 |
IV. Investment Strategy Comparison: SEAM vs QNT
Long-term vs Short-term Investment Strategies
- SEAM: Suitable for investors focused on DeFi lending and borrowing potential
- QNT: Suitable for investors seeking interoperability solutions and enterprise adoption
Risk Management and Asset Allocation
- Conservative investors: SEAM: 20% vs QNT: 80%
- Aggressive investors: SEAM: 40% vs QNT: 60%
- Hedging tools: Stablecoin allocation, options, cross-currency portfolios
V. Potential Risk Comparison
Market Risk
- SEAM: Higher volatility due to smaller market cap and newer project status
- QNT: Exposure to broader crypto market trends and altcoin cycles
Technical Risk
- SEAM: Scalability, network stability on Base
- QNT: Adoption rate of Overledger, potential security vulnerabilities
Regulatory Risk
- Global regulatory policies may impact both differently, with QNT potentially facing more scrutiny due to its interoperability focus
VI. Conclusion: Which Is the Better Buy?
📌 Investment Value Summary:
- SEAM advantages: First native DeFi lending protocol on Base, potential for growth in emerging ecosystem
- QNT advantages: Established interoperability solution, significant institutional interest, limited supply model
✅ Investment Advice:
- New investors: Consider QNT for its more established market position and institutional adoption
- Experienced investors: Balanced portfolio with both SEAM and QNT, leveraging DeFi and interoperability trends
- Institutional investors: Focus on QNT due to its enterprise-grade solutions and significant transaction volumes
⚠️ Risk Warning: The cryptocurrency market is highly volatile. This article does not constitute investment advice. None
VII. FAQ
Q1: What are the main differences between SEAM and QNT? A: SEAM is a newer project focused on decentralized lending and borrowing on the Base network, while QNT is an established interoperability solution with a focus on enterprise adoption. QNT has a limited supply model, while SEAM's tokenomics are not fully specified in the available data.
Q2: Which token has shown better price performance recently? A: QNT has shown better price stability, currently trading around $105.57, while SEAM has experienced more volatility, dropping from its all-time high of $15.39 to current levels around $0.3987.
Q3: How do institutional adoption and market applications compare between SEAM and QNT? A: QNT demonstrates more significant institutional adoption, with recent whale activity transferring $3.42 million worth of QNT from Binance. It also shows value in cross-border transactions. SEAM's institutional adoption is less clear from the available data.
Q4: What are the long-term price predictions for SEAM and QNT by 2030? A: For SEAM, the base scenario predicts $0.50 - $0.73, with an optimistic scenario of $0.73 - $0.79. For QNT, the base scenario predicts $188.39 - $254.58, with an optimistic scenario of $254.58 - $374.24.
Q5: How should investors allocate their portfolio between SEAM and QNT? A: Conservative investors might consider allocating 20% to SEAM and 80% to QNT, while aggressive investors might opt for 40% SEAM and 60% QNT. However, individual allocations should be based on personal risk tolerance and investment goals.
Q6: What are the main risks associated with investing in SEAM and QNT? A: SEAM faces higher volatility due to its smaller market cap and newer project status, as well as potential technical risks related to scalability and network stability. QNT is exposed to broader crypto market trends and may face more regulatory scrutiny due to its interoperability focus.
Share
Content