2025 WHYPrice Prediction: Market Analysis and Growth Potential for Investors
Introduction: WHY's Market Position and Investment Value
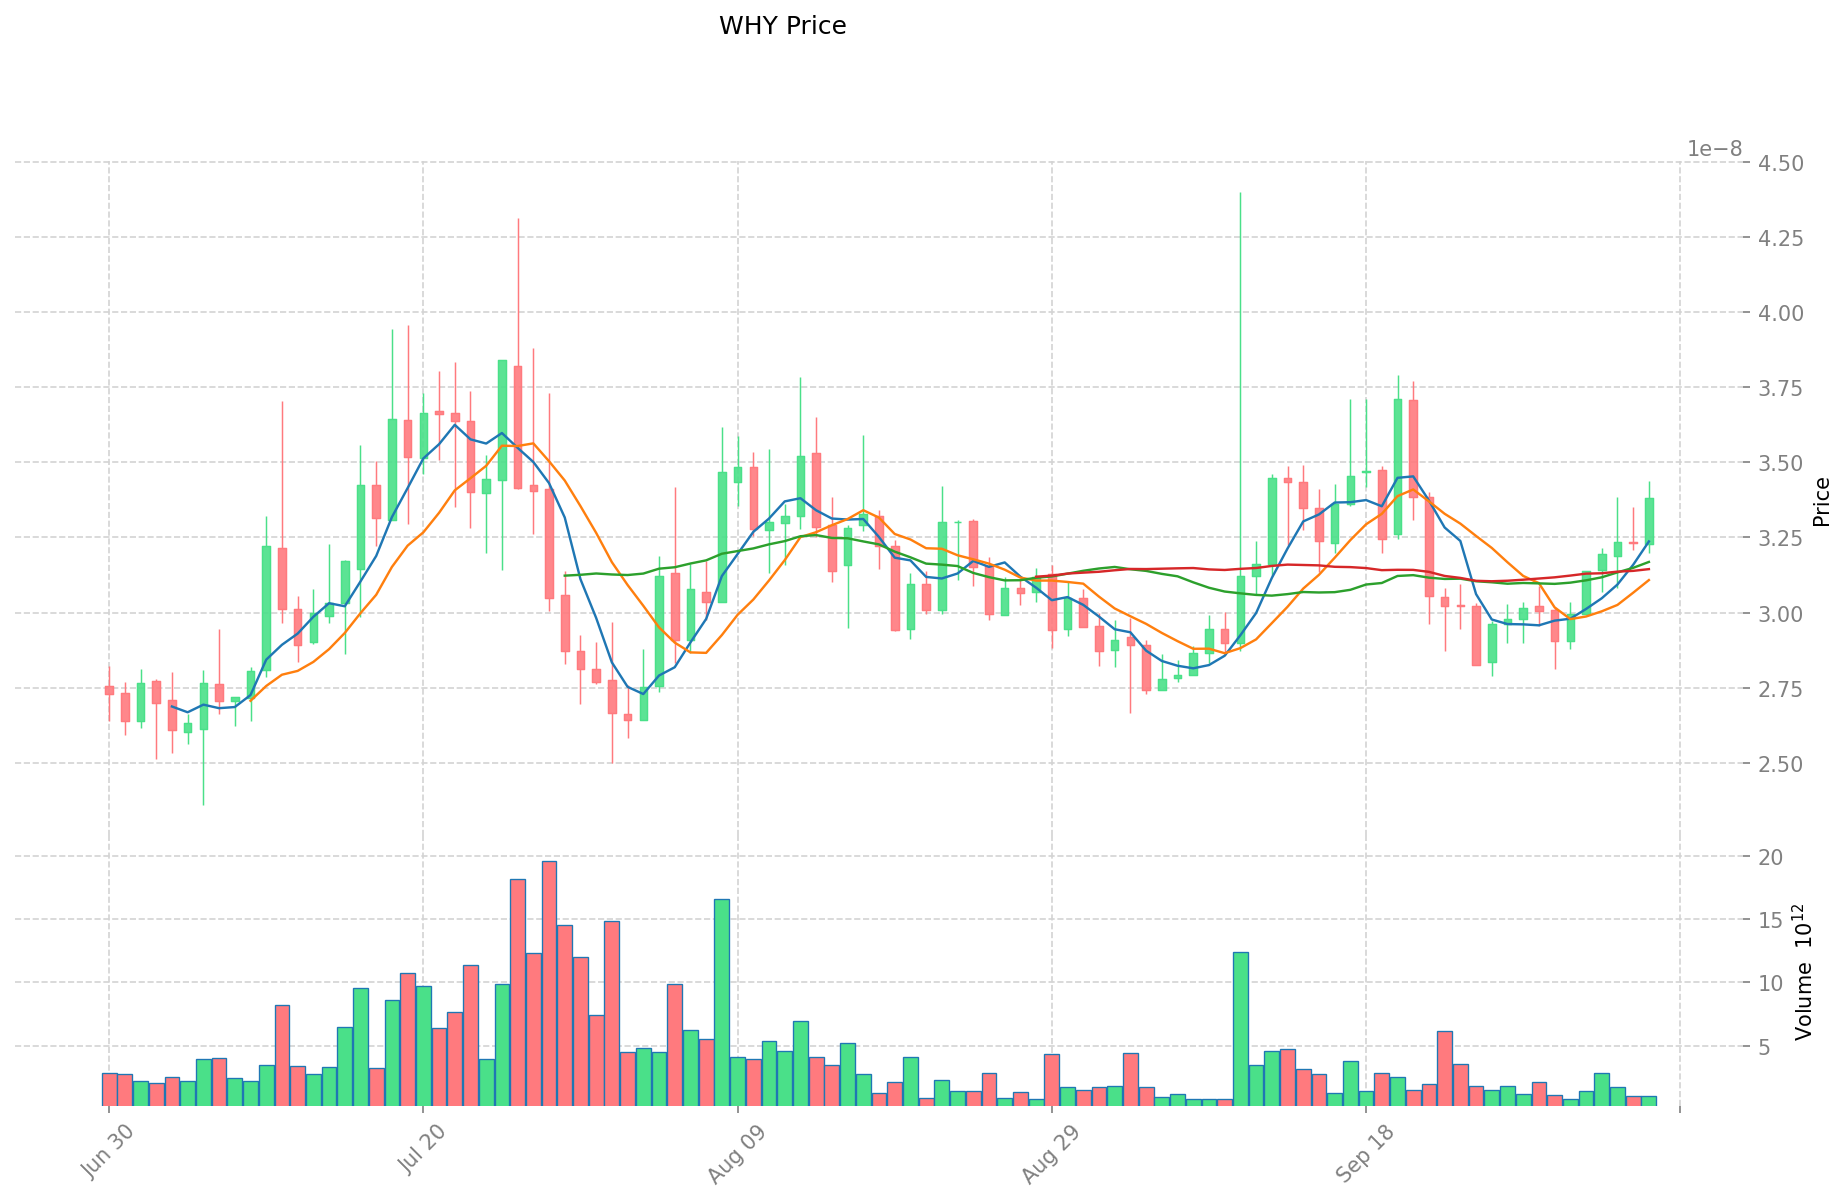
WHY (WHY), positioned as a unique meme token in the cryptocurrency market, has made significant strides since its inception. As of 2025, WHY's market capitalization stands at $14,267,400, with a circulating supply of 420,000,000,000,000 tokens and a price hovering around $0.00000003397. This asset, often referred to as "the Bipolar Elephant," is playing an increasingly crucial role in the meme token and community engagement sectors of the crypto ecosystem.
This article will provide a comprehensive analysis of WHY's price trends from 2025 to 2030, combining historical patterns, market supply and demand, ecosystem development, and macroeconomic factors to offer professional price predictions and practical investment strategies for investors.
I. WHY Price History Review and Current Market Status
WHY Historical Price Evolution Trajectory
- 2024: WHY reached its all-time high of $0.0000005 on November 25, 2024, marking a significant milestone for the project.
- 2025: The token experienced a sharp decline, hitting its all-time low of $0.00000002356 on June 19, 2025.
WHY Current Market Situation
As of October 7, 2025, WHY is trading at $0.00000003397, showing a 4.01% increase in the last 24 hours. The token has displayed notable price movements across different timeframes:
- 1-hour change: -0.61%
- 7-day change: +13.65%
- 30-day change: +19.98%
- 1-year change: -86.99%
WHY's market capitalization currently stands at $14,267,400, ranking it at 1254 in the cryptocurrency market. The token's 24-hour trading volume is $33,412.61, indicating moderate market activity.
Despite the significant drop from its all-time high, WHY has shown signs of recovery in recent weeks, with positive gains over the 7-day and 30-day periods. However, the substantial year-on-year decline of 86.99% suggests that the token is still far from its previous peak performance.
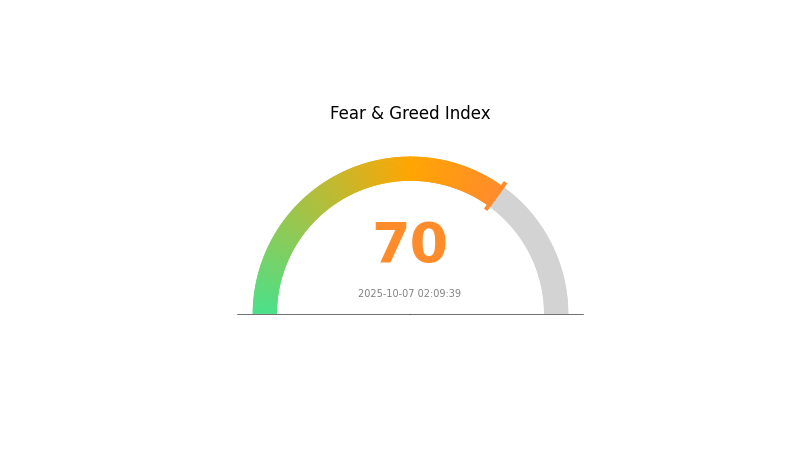
The current market sentiment for cryptocurrencies is characterized as "Greed" with a VIX index of 70, which may influence WHY's price movements in the short term.
Click to view the current WHY market price
WHY Market Sentiment Indicator
2025-10-07 Fear and Greed Index: 70 (Greed)
Click to view the current Fear & Greed Index
The crypto market is currently in a state of greed, with the Fear and Greed Index at 70. This indicates high investor confidence and optimism. However, caution is advised as extreme greed can lead to overbought conditions and potential market corrections. Traders should consider taking profits or hedging positions. It's crucial to maintain a balanced approach and not let emotions drive investment decisions. Remember, market sentiment can shift quickly, so stay informed and adjust strategies accordingly.
WHY Holdings Distribution
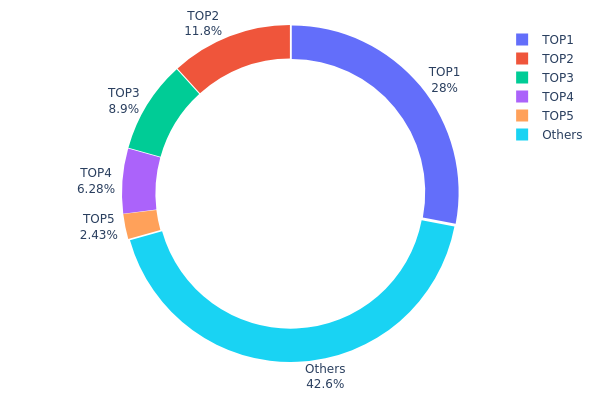
The address holdings distribution data provides crucial insights into the concentration of WHY tokens across different addresses. Analysis of this data reveals a significant concentration in the top addresses, with the top holder possessing 28% of the total supply. The top five addresses collectively control 57.34% of WHY tokens, indicating a high degree of centralization.
This concentration pattern raises concerns about potential market manipulation and price volatility. With such a large portion of tokens held by a few addresses, any significant movement from these holders could dramatically impact the market. The dominance of top holders may also affect the overall decentralization and governance structure of the WHY ecosystem.
However, it's worth noting that 42.66% of tokens are distributed among other addresses, suggesting some level of wider participation. This distribution pattern reflects a market structure that balances between centralized control and broader distribution, though leaning towards centralization. Future shifts in this distribution will be crucial to monitor for assessing the long-term stability and decentralization of the WHY token ecosystem.
Click to view the current WHY Holdings Distribution
| Top | Address | Holding Qty | Holding (%) |
|---|---|---|---|
| 1 | 0x6cd0...7ca8cc | 117626086271.24K | 28.00% |
| 2 | 0xc882...84f071 | 49390783741.30K | 11.75% |
| 3 | 0x0d07...b492fe | 37387530473.89K | 8.90% |
| 4 | 0x1ab4...8f8f23 | 26370557236.71K | 6.27% |
| 5 | 0x73d8...4946db | 10190545442.91K | 2.42% |
| - | Others | 179034496833.95K | 42.66% |
II. Core Factors Influencing WHY's Future Price
Macroeconomic Environment
- Monetary Policy Impact: Major central banks are expected to maintain accommodative policies, potentially supporting WHY's price.
- Inflation Hedging Properties: WHY has shown resilience as an inflation hedge, attracting investors during periods of high inflation.
- Geopolitical Factors: International tensions and uncertainties may drive demand for WHY as a safe-haven asset.
Technological Development and Ecosystem Building
- Ecosystem Applications: Major DApps and ecosystem projects are likely to enhance WHY's utility and adoption.
III. WHY Price Prediction for 2025-2030
2025 Outlook
- Conservative prediction: $18.00 - $20.00
- Neutral prediction: $20.00 - $22.00
- Optimistic prediction: $22.00 - $24.00 (requires sustained market growth)
2027-2028 Outlook
- Market phase expectation: Potential bull market phase
- Price range forecast:
- 2027: $24.00 - $28.80
- 2028: $33.36 - $40.03
- Key catalysts: Increased adoption, technological advancements, and favorable regulatory environment
2029-2030 Long-term Outlook
- Base scenario: $48.04 - $57.65 (assuming steady market growth)
- Optimistic scenario: $57.65 - $69.18 (assuming strong market performance)
- Transformative scenario: $69.18 - $83.02 (assuming breakthrough innovations and mass adoption)
- 2030-12-31: WHY $83.02 (potential peak based on projected growth)
| 年份 | 预测最高价 | 预测平均价格 | 预测最低价 | 涨跌幅 |
|---|---|---|---|---|
| 2025 | 0 | 0 | 0 | 0 |
| 2026 | 0 | 0 | 0 | 8 |
| 2027 | 0 | 0 | 0 | 20 |
| 2028 | 0 | 0 | 0 | 39 |
| 2029 | 0 | 0 | 0 | 45 |
| 2030 | 0 | 0 | 0 | 77 |
IV. Professional Investment Strategies and Risk Management for WHY
WHY Investment Methodology
(1) Long-term Holding Strategy
- Suitable for: Risk-tolerant investors with a long-term perspective
- Operational suggestions:
- Accumulate WHY tokens during market dips
- Set up regular purchase plans to average out entry prices
- Store tokens in a secure Gate Web3 wallet
(2) Active Trading Strategy
- Technical analysis tools:
- Moving Averages: Use to identify trends and potential reversal points
- Relative Strength Index (RSI): Monitor overbought and oversold conditions
- Key points for swing trading:
- Pay attention to trading volume and price action
- Set strict stop-loss and take-profit levels
WHY Risk Management Framework
(1) Asset Allocation Principles
- Conservative investors: 1-3% of crypto portfolio
- Aggressive investors: 5-10% of crypto portfolio
- Professional investors: Up to 15% of crypto portfolio
(2) Risk Hedging Solutions
- Diversification: Spread investments across different cryptocurrencies and asset classes
- Use of stop-loss orders: Implement to limit potential losses
(3) Secure Storage Solutions
- Hot wallet recommendation: Gate Web3 wallet
- Cold storage solution: Hardware wallet for long-term holdings
- Security precautions: Enable two-factor authentication, use strong passwords, and be cautious of phishing attempts
V. Potential Risks and Challenges for WHY
WHY Market Risks
- High volatility: WHY price can experience significant fluctuations
- Limited liquidity: May face challenges in executing large trades without impacting price
- Market sentiment: Susceptible to broader crypto market trends and investor emotions
WHY Regulatory Risks
- Uncertain regulatory landscape: Potential for new regulations affecting meme coins
- Exchange delisting risk: Possibility of being removed from trading platforms due to regulatory concerns
- Tax implications: Evolving tax laws may impact WHY investors
WHY Technical Risks
- Smart contract vulnerabilities: Potential for exploits in the underlying token contract
- Network congestion: High transaction fees and slow confirmations during peak usage
- Wallet security: Risk of loss due to user error or compromised wallets
VI. Conclusion and Action Recommendations
WHY Investment Value Assessment
WHY presents a high-risk, high-reward opportunity within the meme coin segment. While it offers potential for significant gains, investors should be prepared for extreme volatility and the possibility of substantial losses.
WHY Investment Recommendations
✅ Novice: Invest only a small amount you can afford to lose, focusing on education and market understanding ✅ Experienced investors: Consider allocating a small portion of your crypto portfolio, with strict risk management ✅ Institutional investors: Approach with caution, potentially using WHY for short-term trading strategies
WHY Trading Participation Methods
- Spot trading: Buy and sell WHY tokens directly on Gate.com
- Limit orders: Set specific buy or sell prices to execute trades automatically
- Dollar-cost averaging: Regularly purchase small amounts of WHY to average out price volatility
Cryptocurrency investments carry extremely high risks, and this article does not constitute investment advice. Investors should make decisions carefully based on their own risk tolerance and are advised to consult professional financial advisors. Never invest more than you can afford to lose.
FAQ
Why price prediction 2025?
WHY is predicted to reach $0.072481 by November 3, 2025, based on technical analysis. This forecast indicates a 25.11% drop from current levels.
Why is stock price prediction important?
Stock price prediction aids decision-making, helps understand market trends, and enables investors to make informed choices and manage risks effectively.
Why meme coin price prediction?
Meme coin price prediction helps investors navigate the volatile market, anticipate potential gains or losses, and make informed decisions in this rapidly evolving crypto sector.
What will Wink be worth in 2030?
Based on current market analysis, Wink is projected to reach $0.039223 by 2030, assuming a growth rate of 27.63%.
Share
Content