2025 SIS Price Prediction: Analysis of Market Trends and Growth Potential in the Blockchain Industry
Introduction: SIS's Market Position and Investment Value
Symbiosis (SIS), as a decentralized multi-chain liquidity protocol, has been facilitating asset transfers across multiple blockchains since its inception. As of 2025, Symbiosis has achieved a market capitalization of $8,527,448, with a circulating supply of approximately 81,524,359 tokens, and a price hovering around $0.1046. This asset, often referred to as a "cross-chain liquidity facilitator," is playing an increasingly crucial role in decentralized finance (DeFi) and cross-chain interoperability.
This article will comprehensively analyze the price trends of Symbiosis from 2025 to 2030, combining historical patterns, market supply and demand, ecosystem development, and macroeconomic factors to provide investors with professional price predictions and practical investment strategies.
I. SIS Price History Review and Current Market Status
SIS Historical Price Evolution
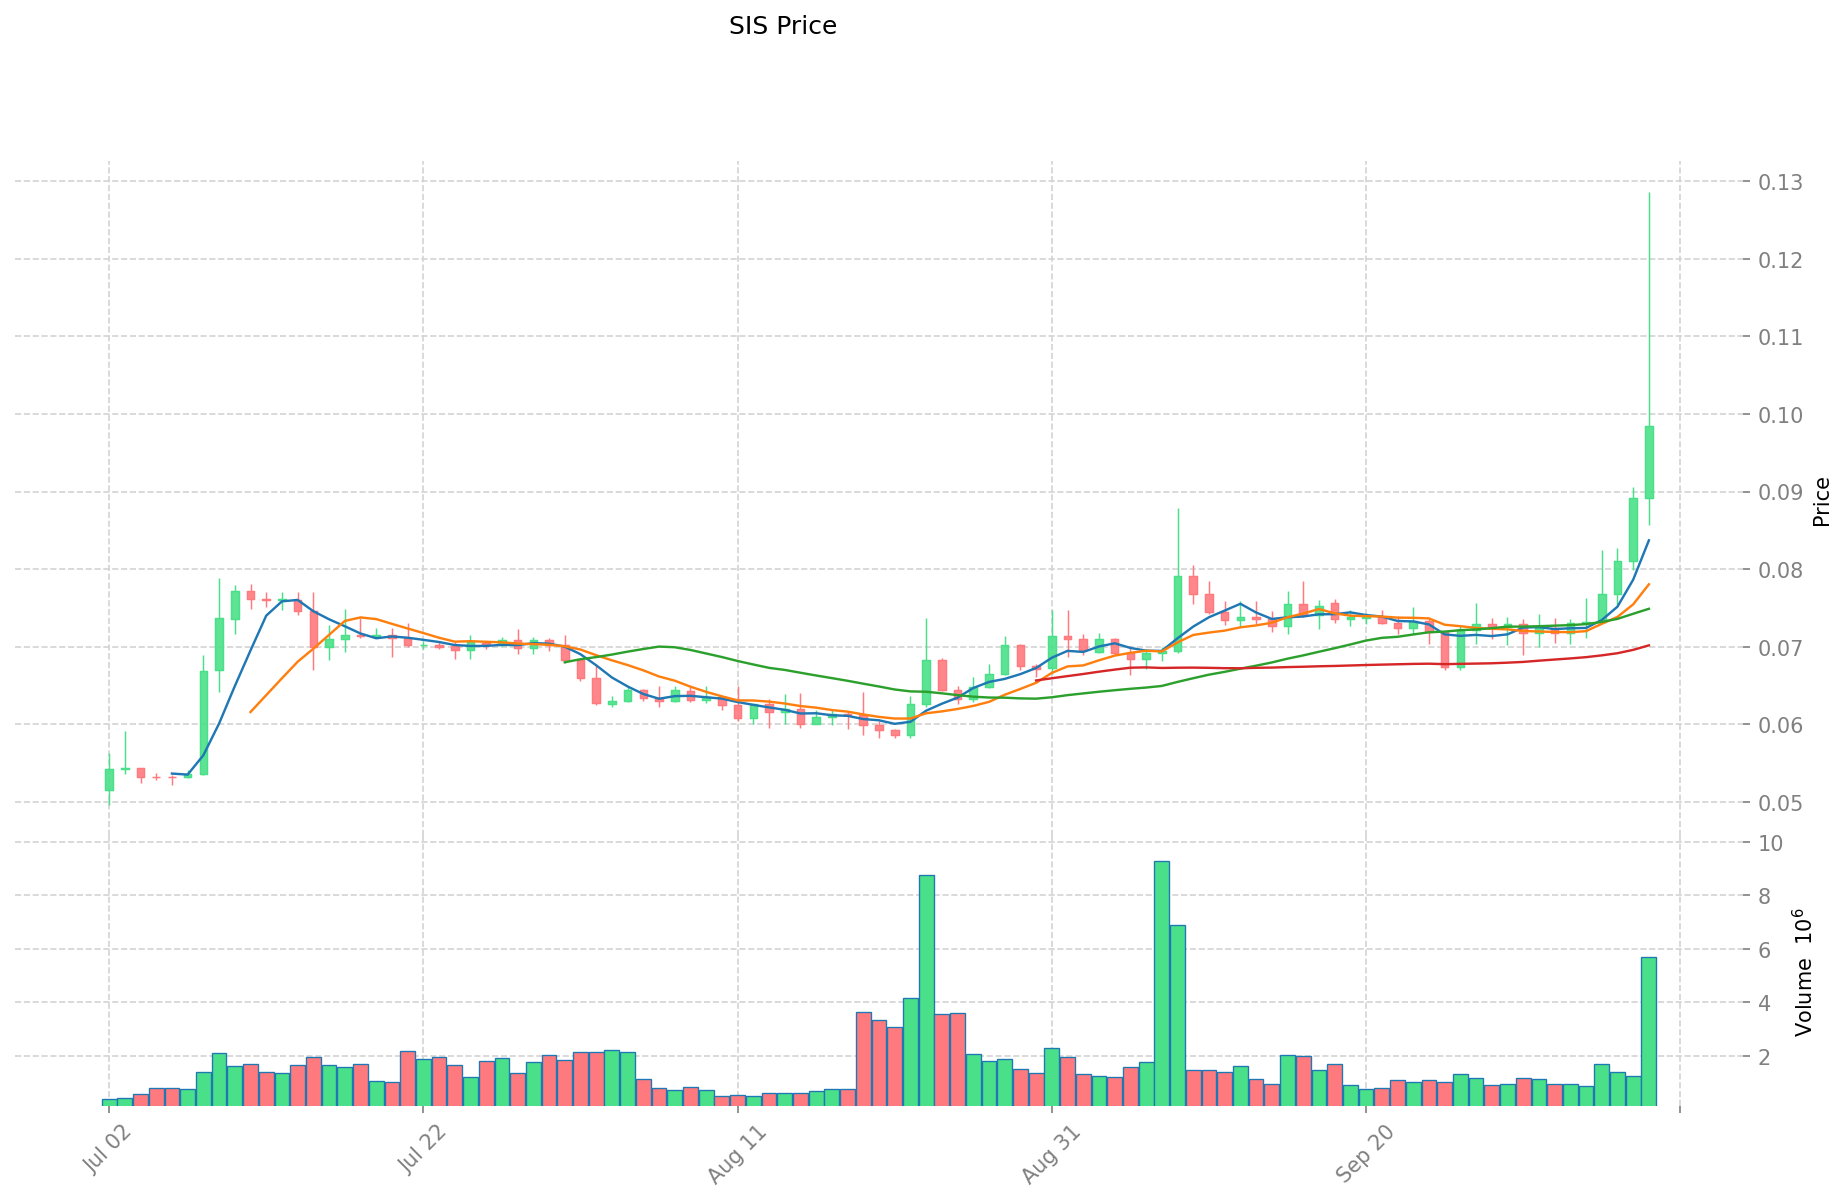
- 2022: All-time high reached, price peaked at $5.59
- 2025: Market downturn, price dropped to all-time low of $0.0451631
- 2025: Recent recovery, price rebounded to $0.1046
SIS Current Market Situation
SIS is currently trading at $0.1046, showing a significant 18.05% increase in the last 24 hours. The token has demonstrated strong momentum over the past week with a 43.4% surge. However, its year-on-year performance remains negative, with a 49.7% decrease compared to last year. The current market capitalization stands at $8,527,448, ranking SIS at 1498 in the crypto market. The 24-hour trading volume is $711,369, indicating moderate market activity. Despite recent gains, SIS is still trading 98.13% below its all-time high of $5.59, suggesting potential room for growth if market conditions improve.
Click to view the current SIS market price
SIS Market Sentiment Indicator
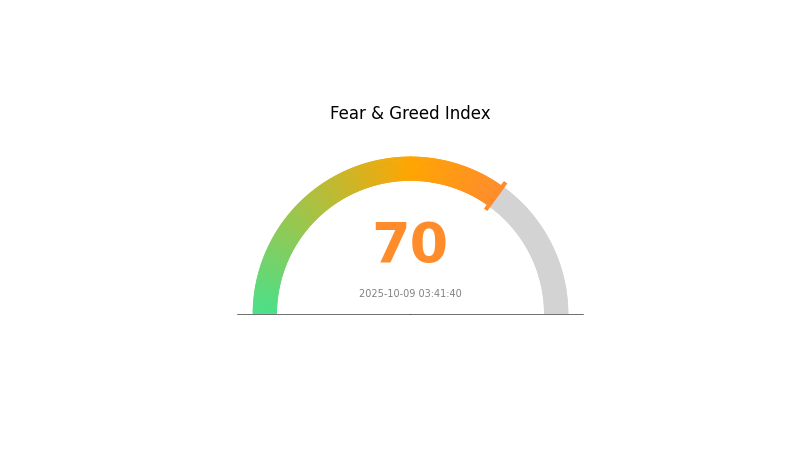
2025-10-09 Fear and Greed Index: 70 (Greed)
Click to view the current Fear & Greed Index
The crypto market is showing signs of excessive optimism, with the Fear and Greed Index reaching 70, indicating a state of greed. This suggests that investors are becoming overly confident, potentially leading to overvalued assets. While bullish sentiment can drive prices higher in the short term, it's crucial to remain cautious. Experienced traders may consider taking some profits or hedging their positions. For those looking to enter the market, it might be wise to wait for a possible correction or practice dollar-cost averaging to mitigate risks.
SIS Holdings Distribution
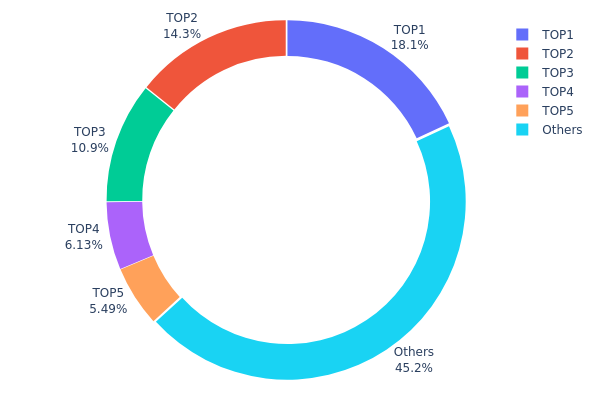
The address holdings distribution data for SIS reveals a relatively concentrated ownership structure. The top five addresses collectively hold 54.81% of the total SIS supply, with the largest holder possessing 18.05%. This concentration level suggests a significant influence of major holders on the token's market dynamics.
Such a distribution pattern may lead to increased price volatility and potential market manipulation risks. The substantial holdings of top addresses could impact liquidity and price movements if large transactions occur. However, with 45.19% of tokens distributed among other addresses, there is still a degree of decentralization present in the SIS ecosystem.
Overall, this distribution reflects a market structure with notable centralization tendencies, potentially affecting the token's stability and susceptibility to large holder actions. Monitoring changes in this distribution over time would be crucial for assessing the evolving decentralization and market health of SIS.
Click to view current SIS Holdings Distribution
| Top | Address | Holding Qty | Holding (%) |
|---|---|---|---|
| 1 | 0x3c68...384e8b | 17965.40K | 18.05% |
| 2 | 0xf89d...5eaa40 | 14197.45K | 14.27% |
| 3 | 0xa3a7...d60eec | 10837.11K | 10.89% |
| 4 | 0xb8f2...9e81a8 | 6098.39K | 6.12% |
| 5 | 0xddac...cb0374 | 5460.99K | 5.48% |
| - | Others | 44930.42K | 45.19% |
II. Key Factors Affecting Future SIS Prices
Supply Mechanism
- Industrial Production: Global industrialization is driving SIS market growth.
- Historical Pattern: Increased demand for linear and radial SIS types has accelerated market expansion.
- Current Impact: Continued growth in end-use industries is expected to maintain upward pressure on SIS prices.
Macroeconomic Environment
- Inflation Hedging Properties: As a chemical product, SIS may serve as a potential hedge against inflation in certain industrial applications.
Technological Development and Ecosystem Building
- Integrated Platforms: A key driver of the SIS market is the shift towards integrated platforms that offer connectivity with other educational tools.
- Personalized Learning: The trend of personalized learning is influencing the development of SIS platforms, with educational institutions seeking systems that can adapt to individual student needs.
III. SIS Price Prediction for 2025-2030
2025 Outlook
- Conservative prediction: $0.09808 - $0.10324
- Neutral prediction: $0.10324 - $0.11305
- Optimistic prediction: $0.11305 - $0.12286 (requires positive market sentiment)
2027-2028 Outlook
- Market phase expectation: Potential growth phase
- Price range forecast:
- 2027: $0.07705 - $0.17819
- 2028: $0.08659 - $0.16123
- Key catalysts: Increased adoption and technological advancements
2030 Long-term Outlook
- Base scenario: $0.14533 - $0.16147 (assuming steady market growth)
- Optimistic scenario: $0.16147 - $0.19054 (assuming strong market performance)
- Transformative scenario: Above $0.19054 (extreme favorable conditions)
- 2030-12-31: SIS $0.19054 (potential peak)
| 年份 | 预测最高价 | 预测平均价格 | 预测最低价 | 涨跌幅 |
|---|---|---|---|---|
| 2025 | 0.12286 | 0.10324 | 0.09808 | -1 |
| 2026 | 0.12774 | 0.11305 | 0.06218 | 8 |
| 2027 | 0.17819 | 0.1204 | 0.07705 | 15 |
| 2028 | 0.16123 | 0.14929 | 0.08659 | 42 |
| 2029 | 0.16768 | 0.15526 | 0.12732 | 48 |
| 2030 | 0.19054 | 0.16147 | 0.14533 | 54 |
IV. SIS Professional Investment Strategies and Risk Management
SIS Investment Methodology
(1) Long-term Holding Strategy
- Suitable for: Risk-tolerant investors with a long-term perspective
- Operation suggestions:
- Accumulate SIS tokens during market dips
- Set price targets for partial profit-taking
- Store tokens in a secure hardware wallet
(2) Active Trading Strategy
- Technical analysis tools:
- Moving Averages: Monitor short-term and long-term trends
- RSI (Relative Strength Index): Identify overbought and oversold conditions
- Key points for swing trading:
- Set stop-loss orders to limit potential losses
- Take profits at predetermined resistance levels
SIS Risk Management Framework
(1) Asset Allocation Principles
- Conservative investors: 1-3%
- Aggressive investors: 5-10%
- Professional investors: 10-15%
(2) Risk Hedging Solutions
- Diversification: Allocate investments across multiple cryptocurrencies and traditional assets
- Options strategies: Use put options to protect against downside risk
(3) Secure Storage Solutions
- Hot wallet recommendation: Gate Web3 Wallet
- Cold storage solution: Use hardware wallets for long-term storage
- Security precautions: Enable two-factor authentication, use strong passwords, and regularly update software
V. Potential Risks and Challenges for SIS
SIS Market Risks
- High volatility: SIS price can experience significant fluctuations
- Limited liquidity: Potential difficulty in executing large trades without affecting price
- Market sentiment: Susceptible to broader cryptocurrency market trends
SIS Regulatory Risks
- Uncertain regulatory environment: Potential for increased scrutiny of DeFi projects
- Cross-chain compliance: Challenges in adhering to regulations across multiple blockchains
- Token classification: Risk of being classified as a security in some jurisdictions
SIS Technical Risks
- Smart contract vulnerabilities: Potential for exploits in the protocol's code
- Cross-chain bridge security: Risks associated with assets moving between blockchains
- Scalability challenges: Potential network congestion during high-demand periods
VI. Conclusion and Action Recommendations
SIS Investment Value Assessment
Symbiosis Finance (SIS) offers long-term potential as a multi-chain liquidity protocol, but faces short-term risks from market volatility and regulatory uncertainty. Its success depends on continued adoption and technological advancements in the DeFi space.
SIS Investment Recommendations
✅ Beginners: Start with small positions and focus on learning about DeFi and cross-chain technologies ✅ Experienced investors: Consider a moderate allocation as part of a diversified crypto portfolio ✅ Institutional investors: Conduct thorough due diligence and consider SIS as part of a broader DeFi investment strategy
SIS Trading Participation Methods
- Spot trading: Purchase SIS tokens on Gate.com
- Yield farming: Participate in liquidity provision on the Symbiosis platform
- DeFi integration: Utilize SIS tokens within the broader DeFi ecosystem
Cryptocurrency investments carry extremely high risks, and this article does not constitute investment advice. Investors should make decisions carefully based on their own risk tolerance and are advised to consult professional financial advisors. Never invest more than you can afford to lose.
FAQ
What is the long-term outlook for SIS?
The long-term outlook for SIS appears promising, with potential for significant growth and increased adoption in the Web3 ecosystem over the next 3-5 years.
What is the target price for SIS stocks?
Based on analyst projections, the average 12-month target price for SIS stocks is $453.25, with estimates ranging from $420 to $473.
What is the future outlook for SIS shares?
SIS shares have a positive outlook, with forecasts indicating strong growth. Earnings are expected to increase by 45.9% annually, while revenue is projected to grow by 9% per year. The company's EPS is anticipated to rise by 45.8% annually.
How much will Shib price be in 2030?
By 2030, Shiba Inu (SHIB) is projected to reach up to $0.00010. Predictions vary, but significant growth is expected. Exact figures are uncertain.
Share
Content