2025 FPrice Prediction: Future Market Trends and Investment Opportunities in the Global Financial Landscape
Introduction: F's Market Position and Investment Value
SynFutures (F), as a leading decentralized exchange and full-stack financial infrastructure provider, has made significant strides since its inception. As of 2025, SynFutures' market capitalization has reached $14,536,800, with a circulating supply of approximately 1,200,000,000 tokens, and a price hovering around $0.012114. This asset, known for its innovative "Oyster AMM model," is playing an increasingly crucial role in decentralized derivatives trading and financial infrastructure.
This article will comprehensively analyze SynFutures' price trends from 2025 to 2030, considering historical patterns, market supply and demand, ecosystem development, and macroeconomic factors to provide investors with professional price forecasts and practical investment strategies.
I. F Price History Review and Current Market Status
F Historical Price Evolution
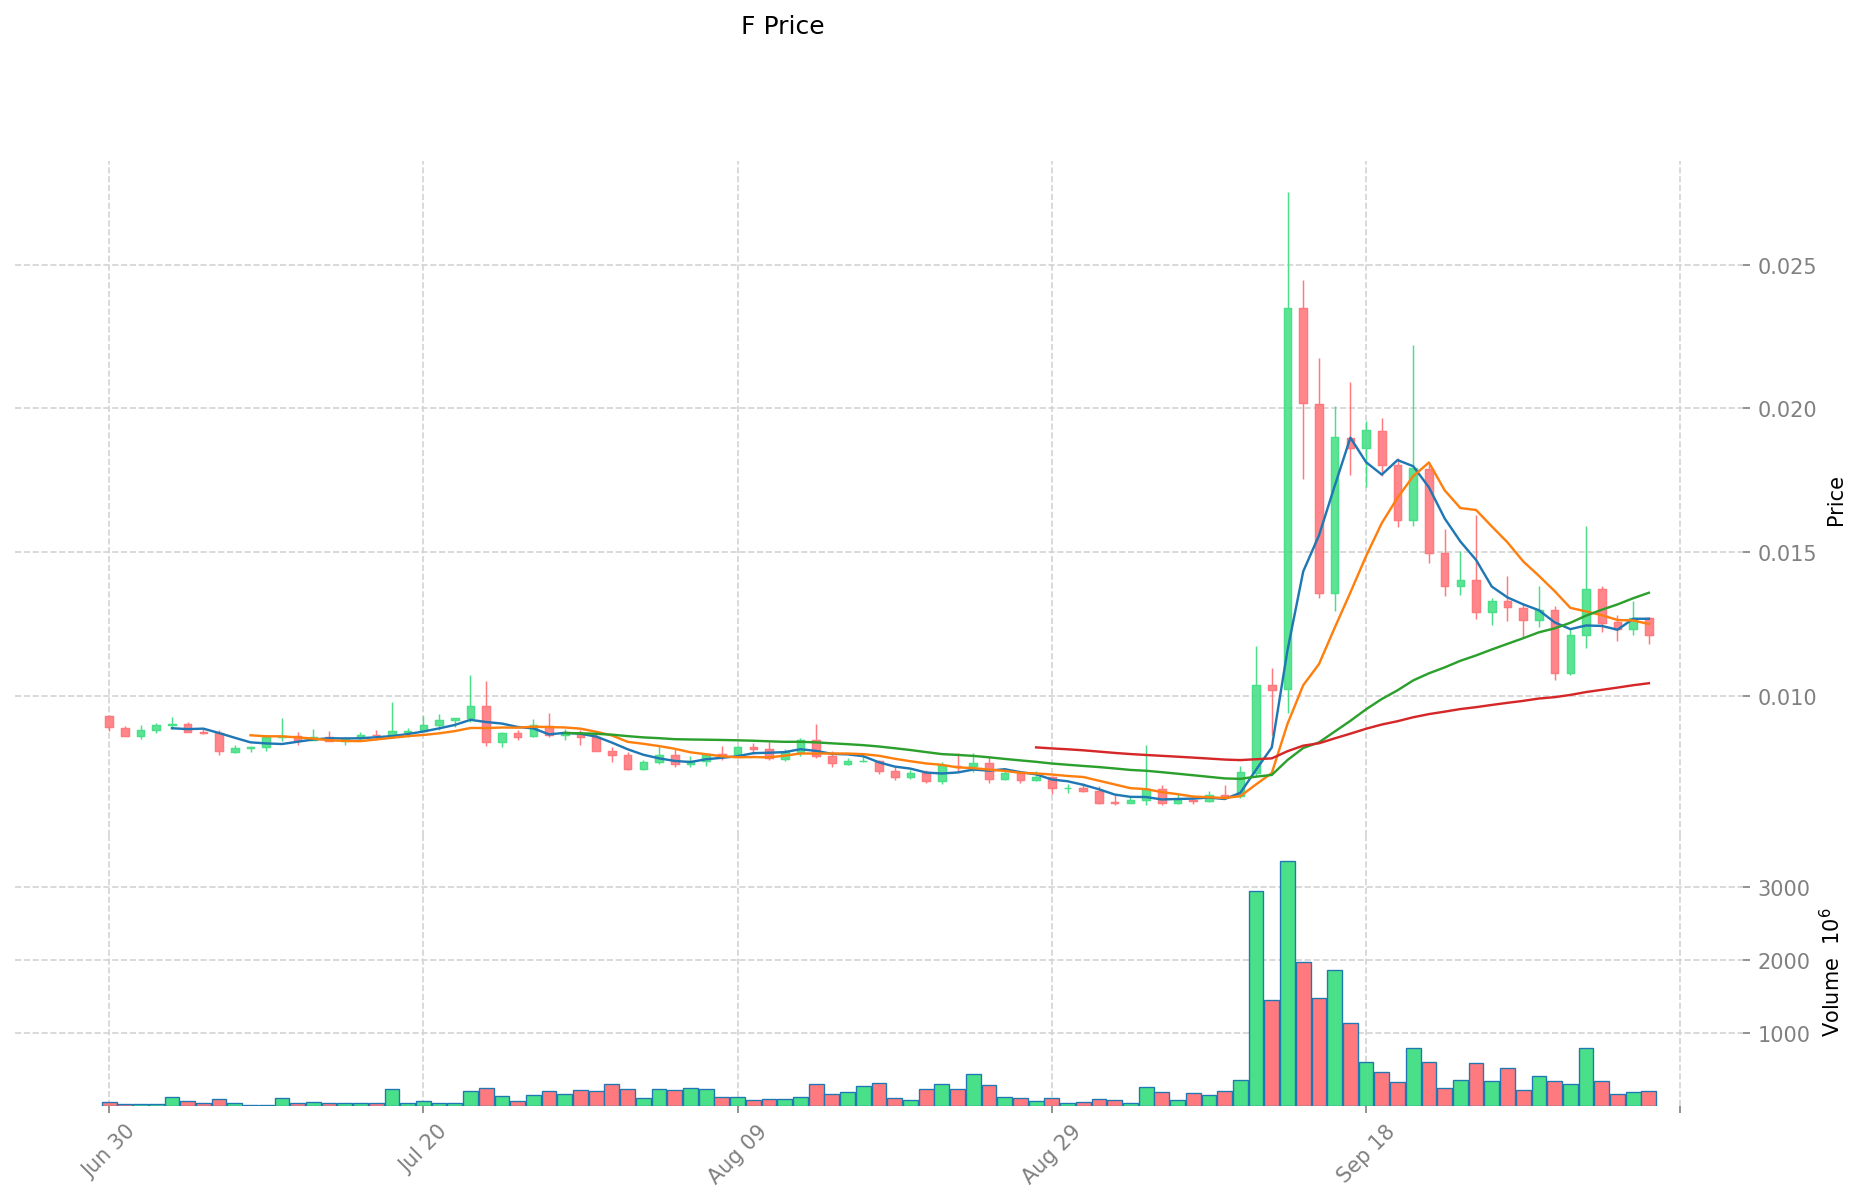
- 2024: Project launch, price peaked at $0.2905 on December 6th
- 2025: Market correction, price dropped to an all-time low of $0.006176 on September 2nd
- 2025: Recent recovery, price rebounded by 89.69% in the past 30 days
F Current Market Situation
As of October 7, 2025, F is trading at $0.012114, with a 24-hour trading volume of $2,657,621.97. The token has experienced a slight decline of 1.93% in the last 24 hours. F's market capitalization stands at $14,536,800, ranking it 1246th in the cryptocurrency market.
The current price represents a significant drop of 90.66% from its all-time high, indicating a challenging year for the token. However, the recent 30-day performance shows a strong recovery of 89.69%, suggesting renewed interest in the project.
F's circulating supply is 1,200,000,000 tokens, which is 12% of its total supply of 10,000,000,000. The fully diluted market cap is $121,140,000, reflecting the potential value if all tokens were in circulation.
Click to view the current F market price
F Market Sentiment Indicator
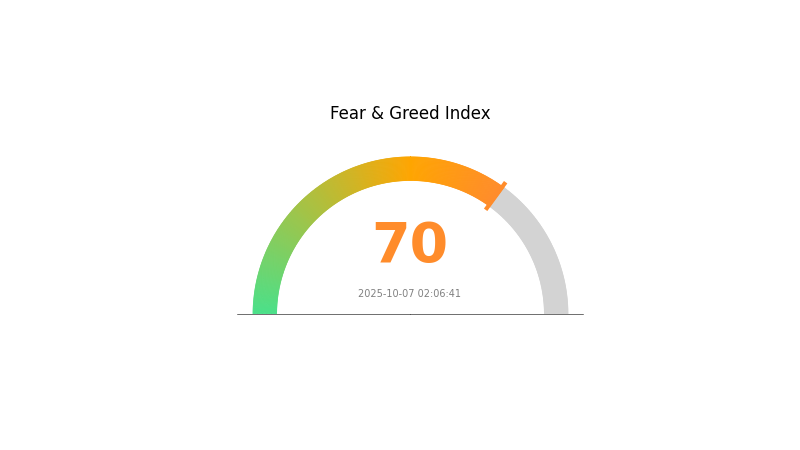
2025-10-07 Fear and Greed Index: 70 (Greed)
Click to view the current Fear & Greed Index
The crypto market is currently in a state of greed, with the Fear and Greed Index standing at 70. This suggests that investors are optimistic and may be prone to making emotional decisions. While positive sentiment can drive prices up, it's crucial to remain cautious. Experienced traders often view extreme greed as a potential signal for market correction. As always, it's advisable to conduct thorough research and consider diversifying your portfolio to manage risk effectively in this bullish environment.
F Holdings Distribution
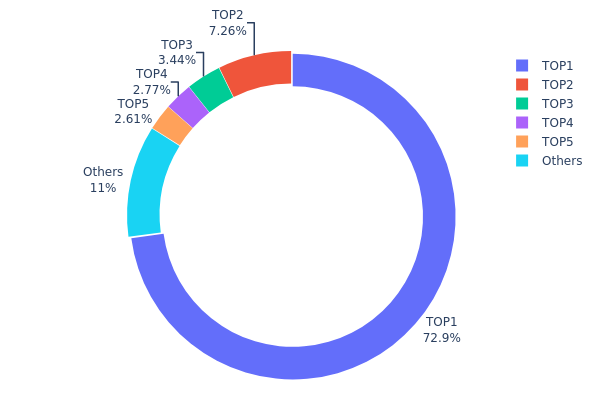
The address holdings distribution data provides crucial insights into the concentration of F tokens across different wallets. Analysis of this data reveals a highly centralized distribution pattern, with the top address holding a staggering 72.88% of the total supply. This level of concentration raises significant concerns about market manipulation and price volatility risks.
The top five addresses collectively control 88.94% of F tokens, further emphasizing the centralized nature of the token's distribution. Such a concentrated holding structure could potentially lead to market instability, as large-scale transactions by these major holders could dramatically impact token price and liquidity. This centralization also contradicts the principles of decentralization often associated with cryptocurrency projects, potentially undermining investor confidence and the overall health of the F token ecosystem.
Click to view the current F Holdings Distribution
| Top | Address | Holding Qty | Holding (%) |
|---|---|---|---|
| 1 | 0x8919...a1da56 | 7288475.17K | 72.88% |
| 2 | 0x85c8...eef08e | 726312.24K | 7.26% |
| 3 | 0xc9cc...04d3bb | 344336.67K | 3.44% |
| 4 | 0x3154...0f2c35 | 276944.08K | 2.76% |
| 5 | 0xc97e...37a2f1 | 260638.30K | 2.60% |
| - | Others | 1103293.54K | 11.06% |
II. Key Factors Influencing F's Future Price
Supply Mechanism
- Supply and Demand: When supply decreases or demand increases, market prices typically rise; conversely, when supply is abundant and demand falls, prices may decline.
Institutional and Large Holder Dynamics
- National Policies: Economic and political factors at the national level can significantly impact price trends.
Macroeconomic Environment
- Monetary Policy Impact: Central bank policies and expectations can influence price movements.
- Inflation Hedging Properties: Performance in inflationary environments may affect price trends.
- Geopolitical Factors: International situations and geopolitical tensions can impact market dynamics.
Technical Development and Ecosystem Building
- News Events: Both positive and negative news can significantly affect price fluctuations, especially in the medium term (measured in days).
- Market Sentiment: Investor confidence, inflation expectations, and market returns can influence price trends, particularly in futures markets.
III. F Price Prediction for 2025-2030
2025 Outlook
- Conservative prediction: $0.01162 - $0.01210
- Neutral prediction: $0.01210 - $0.01446
- Optimistic prediction: $0.01446 - $0.01682 (requires positive market sentiment)
2027-2028 Outlook
- Market phase expectation: Potential growth phase
- Price range forecast:
- 2027: $0.01459 - $0.02126
- 2028: $0.01340 - $0.02252
- Key catalysts: Increased adoption and favorable market conditions
2029-2030 Long-term Outlook
- Base scenario: $0.01762 - $0.02097 (assuming steady market growth)
- Optimistic scenario: $0.02097 - $0.02279 (assuming strong market performance)
- Transformative scenario: Above $0.02279 (extremely favorable market conditions)
- 2030-12-31: F $0.0215 (potential peak price)
| 年份 | 预测最高价 | 预测平均价格 | 预测最低价 | 涨跌幅 |
|---|---|---|---|---|
| 2025 | 0.01682 | 0.0121 | 0.01162 | 0 |
| 2026 | 0.02068 | 0.01446 | 0.01114 | 19 |
| 2027 | 0.02126 | 0.01757 | 0.01459 | 45 |
| 2028 | 0.02252 | 0.01942 | 0.0134 | 60 |
| 2029 | 0.02202 | 0.02097 | 0.01762 | 73 |
| 2030 | 0.02279 | 0.0215 | 0.01376 | 77 |
IV. Professional Investment Strategies and Risk Management for F
F Investment Methodology
(1) Long-term Holding Strategy
- Suitable for: Risk-tolerant investors with a long-term perspective
- Operational suggestions:
- Accumulate F tokens during market dips
- Set clear long-term price targets and reassess periodically
- Store tokens in secure wallets with multi-factor authentication
(2) Active Trading Strategy
- Technical analysis tools:
- Moving Averages: Use to identify trends and potential reversal points
- Relative Strength Index (RSI): Monitor overbought/oversold conditions
- Key points for swing trading:
- Monitor SynFutures' platform growth and user adoption metrics
- Stay informed about new features and partnerships
F Risk Management Framework
(1) Asset Allocation Principles
- Conservative investors: 1-3% of crypto portfolio
- Aggressive investors: 5-10% of crypto portfolio
- Professional investors: Up to 15% of crypto portfolio, depending on risk tolerance
(2) Risk Hedging Solutions
- Diversification: Spread investments across multiple DeFi projects
- Stop-loss orders: Implement to limit potential losses
(3) Secure Storage Solutions
- Hot wallet recommendation: Gate web3 wallet
- Cold storage solution: Hardware wallets for long-term holdings
- Security precautions: Enable two-factor authentication, use strong passwords, and regularly update software
V. Potential Risks and Challenges for F
F Market Risks
- Volatility: Cryptocurrency markets are highly volatile, leading to significant price swings
- Competition: Increasing competition in the DeFi derivatives space
- Liquidity: Potential liquidity issues during extreme market conditions
F Regulatory Risks
- Uncertain regulations: Evolving global regulatory landscape for DeFi and crypto derivatives
- Compliance challenges: Potential difficulties in adhering to diverse international regulations
- Legal status: Unclear legal status of certain DeFi operations in some jurisdictions
F Technical Risks
- Smart contract vulnerabilities: Potential for exploits or bugs in the protocol's smart contracts
- Network congestion: High gas fees or slow transactions on underlying blockchains
- Oracle failures: Risks associated with price feed inaccuracies or manipulations
VI. Conclusion and Action Recommendations
F Investment Value Assessment
SynFutures (F) presents a compelling long-term value proposition as a leading decentralized derivatives platform. However, short-term risks include market volatility, regulatory uncertainties, and technical challenges inherent to the DeFi space.
F Investment Recommendations
✅ Beginners: Start with small positions and focus on education about DeFi and derivatives ✅ Experienced investors: Consider allocating a portion of DeFi portfolio to F, aligned with risk tolerance ✅ Institutional investors: Explore strategic partnerships or larger positions based on thorough due diligence
F Trading Participation Methods
- Spot trading: Buy and hold F tokens on Gate.com
- Staking: Participate in liquidity provision or governance staking if available
- DeFi engagement: Utilize SynFutures platform for derivatives trading to gain hands-on experience
Cryptocurrency investments carry extremely high risks, and this article does not constitute investment advice. Investors should make decisions carefully based on their own risk tolerance and are advised to consult professional financial advisors. Never invest more than you can afford to lose.
FAQ
Is F stock a good investment?
Yes, F stock appears to be a good investment. With strong Value and Growth grades, it shows potential for both current value and future growth. Its diverse product lineup and focus on electric vehicles position it well for future market trends.
What will Ford stock be worth in 2030?
Ford stock is projected to be worth between $8.12 and $17.63 in 2030, based on current analyst forecasts and potential market factors.
Can Ford stock reach $20?
Yes, Ford stock could potentially reach $20. Given its past performance and current market trends, along with strong truck sales and possible interest rate cuts, the stock shows promising growth potential.
What is Ford's long-term potential?
Ford's long-term potential is promising, driven by its EV transition and innovation. However, success depends on overcoming supply chain challenges and fierce market competition.
Share
Content