Trade
Basic
Futures
Futures
Hundreds of contracts settled in USDT or BTC
Options
HOT
Trade European-style vanilla options
Unified Account
Maximize your capital efficiency
Demo Trading
Futures Kickoff
Get prepared for your futures trading
Futures Events
Futures Mall
Participate in events to win generous rewards
Demo Trading
Use virtual funds to experience risk-free trading
Earn
Launch
CandyDrop
Collect candies to earn airdrops
Launchpool
Quick staking, earn potential new tokens
HODLer Airdrop
Hold GT and get massive airdrops for free
Launchpad
Be early to the next big token project
Alpha Points
NEW
Trade on-chain assets and enjoy airdrop rewards!
Futures Points
NEW
Earn futures points and claim airdrop rewards
Investment
Simple Earn
Earn interests with idle tokens
Auto-Invest
Auto-invest on a regular basis
Dual Investment
Buy low and sell high to take profits from price fluctuations
Soft Staking
Earn rewards with flexible staking
Crypto Loan
0 Fees
Pledge one crypto to borrow another
Lending Center
One-stop lending hub
VIP Wealth Hub
Customized wealth management empowers your assets growth
Private Wealth Management
Customized asset management to grow your digital assets
Quant Fund
Top asset management team helps you profit without hassle
Staking
Stake cryptos to earn in PoS products
Smart Leverage
NEW
No forced liquidation before maturity, worry-free leveraged gains
GUSD Minting
Use USDT/USDC to mint GUSD for treasury-level yields
More
SquidGame
ETH Market Analysis
January 27, 2025, 10:00 AM ETH Today Market Analysis
As of 10 PM, the candlestick chart shows a downward correction trend.
The price is around 2935, with the Bollinger Bands' three lines parallel, near 2920, 3010, and 2830.
In the short term, the MA5 and MA10 moving averages have a golden cross and are rising, with the gap widening.
MACD indicator: The MACD double lines are below the zero line, with a golden cross upward, indicating bullish momentum is building.
RSI indicator: RSI14 is around 50, indicating a normal trading phase.
Resistance levels: 2965, 3025, 3080
Support
ETH2,65%
- Reward
- like
- Comment
- Repost
- Share
- Reward
- like
- Comment
- Repost
- Share
- Reward
- like
- Comment
- Repost
- Share
Eurus
Eurus
Created By@YanyanAngelPromoter
Listing Progress
0.00%
MC:
$3.39K
Create My Token
- Reward
- like
- Comment
- Repost
- Share
SOL Market Analysis: The decline temporarily pauses, and the rebound remains a technical correction
After continuous weakness, SOL found effective support around 117, and the price quickly rebounded above 120, temporarily easing the downward trend.
From the overall structure, the bearish pattern has not been fundamentally broken, and the current rebound is only a technical correction. In the short term, when the price rebounds to near the middle line of the four-hour timeframe, it faces obvious resistance. Trading accordingly requires patience, and chasing the rally is strictly prohibited.
Str
SOL1,52%

- Reward
- 1
- Comment
- Repost
- Share

- Reward
- like
- Comment
- Repost
- Share
The market trend is unexpected. BTC 🧭
1
- Reward
- like
- Comment
- Repost
- Share
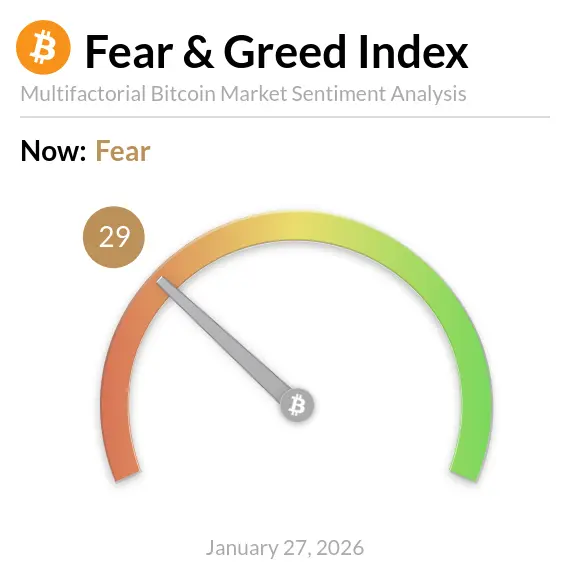
Today is January 27, 2026. The cryptocurrency market has experienced a technical rebound after a decline, but overall sentiment remains cautious. The main characteristics are the coexistence of short-term recovery and medium-term adjustment pressures.
📊 Major Coin Dynamics
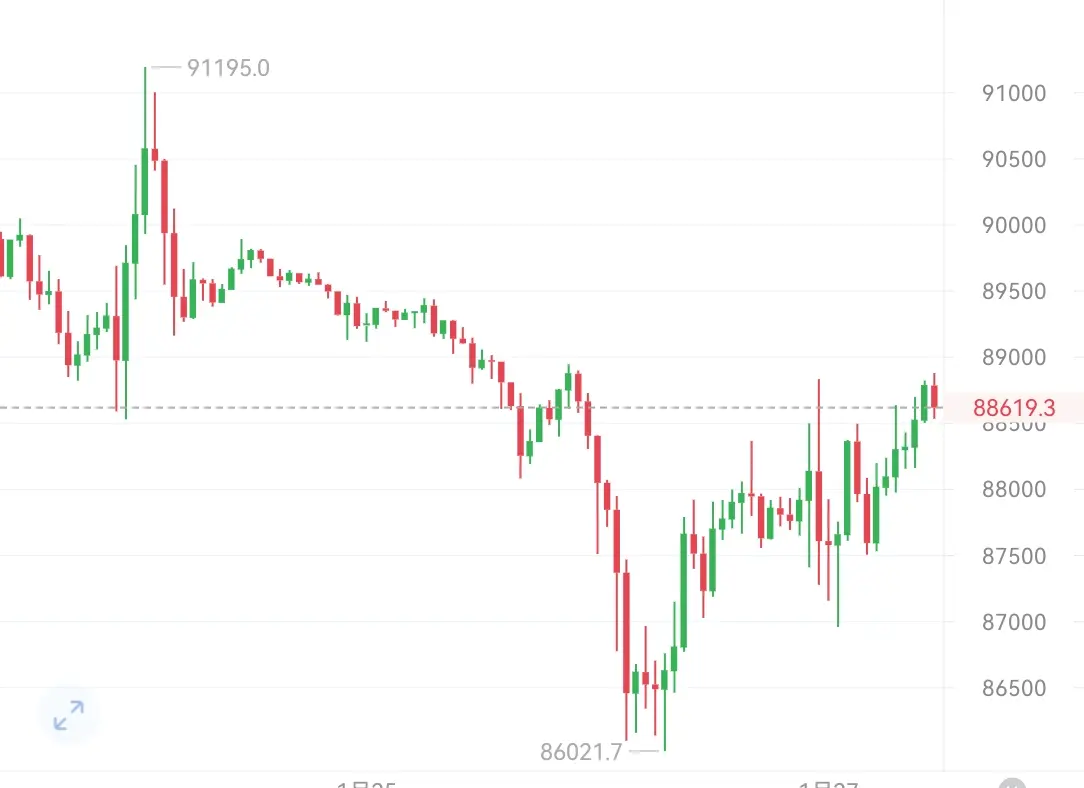
🌿 BTC (Bitcoin): The current price is in the range of $87,000-$88,000. Yesterday, a candlestick with a long lower shadow was formed, indicating strong support around $86,000. Today, it has rebounded slightly by about 1.23%. Key resistance levels above are at $89,000-$90,000. If a volume breakout occurs, further rebound may
View Original📊 Major Coin Dynamics
🌿 BTC (Bitcoin): The current price is in the range of $87,000-$88,000. Yesterday, a candlestick with a long lower shadow was formed, indicating strong support around $86,000. Today, it has rebounded slightly by about 1.23%. Key resistance levels above are at $89,000-$90,000. If a volume breakout occurs, further rebound may


- Reward
- 1
- 1
- Repost
- Share
楚老魔 :
:
2026 Go Go Go 👊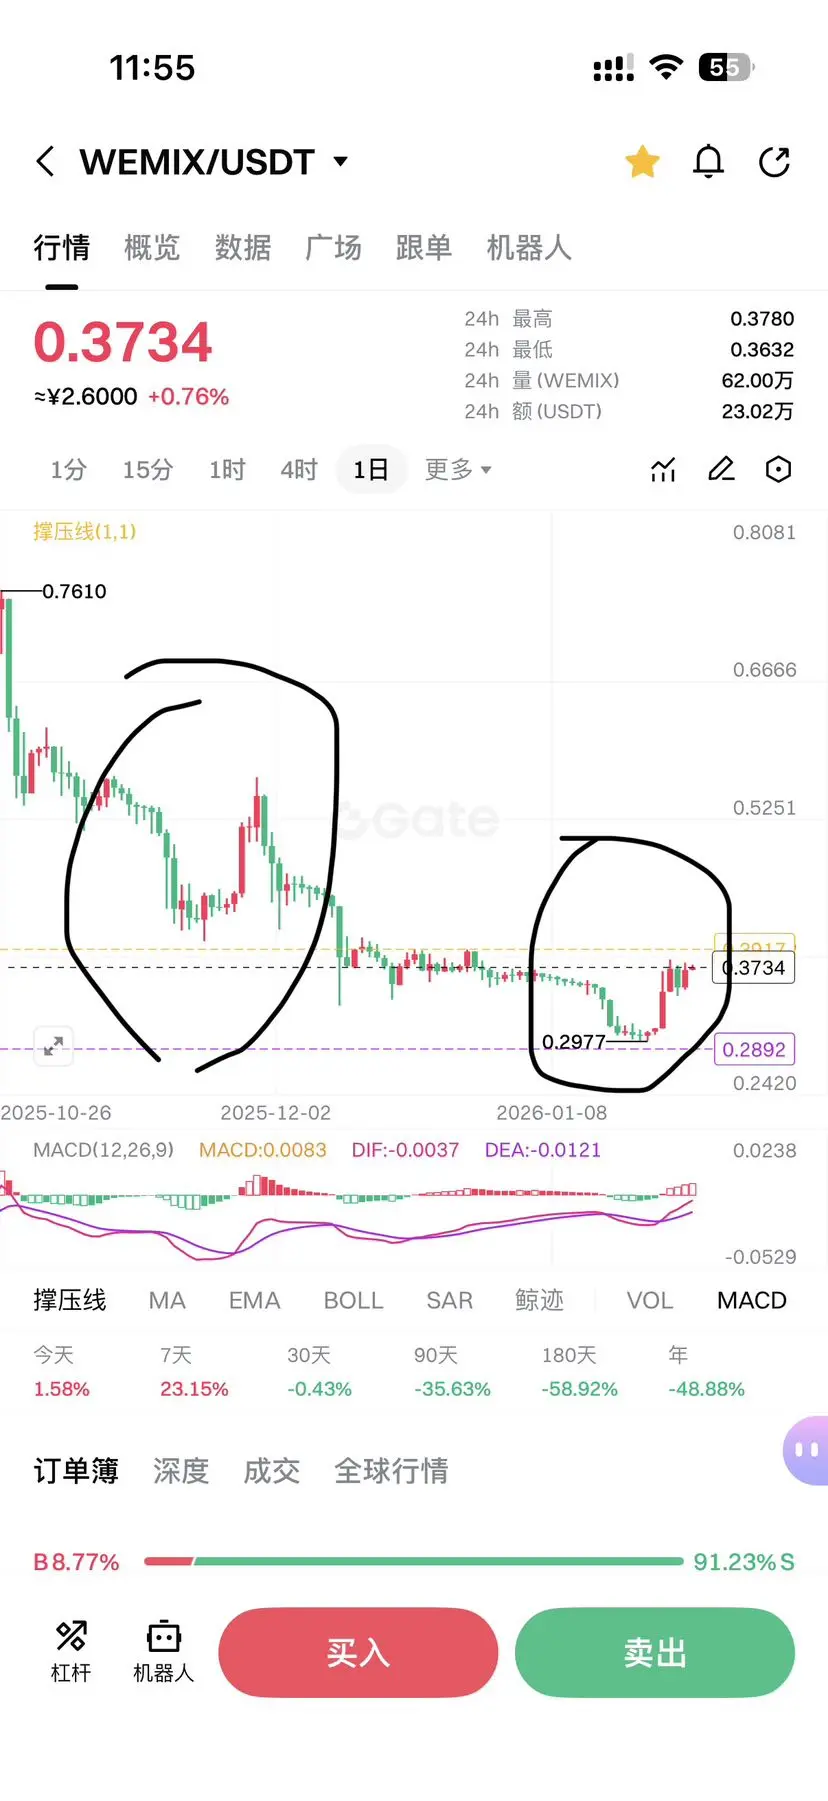
- Reward
- like
- 4
- Repost
- Share
GateUser-ab90d7dc :
:
0.4 is the peak. Once again, it will enter a downward trend. Without new games, breaking through remains too difficult.View More
#GateSquareCreatorNewYearIncentives #GateSquareCreatorNewYearIncentives
Gold is stretched at the top.
Bond markets are flashing instability.
Bitcoin is pausing just under resistance.
But the real story is happening beneath the surface.
What’s catching my attention: 🔹 ETH/BTC is starting to base instead of bleeding
🔹 SOL-related activity is quietly accelerating
🔹 Liquidity is drifting away from pure memes toward utility-driven narratives
This isn’t a phase for chasing excitement. It’s a phase for spotting accumulation before it becomes obvious.
My checklist for the coming days: • ETH reclaim

- Reward
- 3
- 5
- Repost
- Share
AylaShinex :
:
HODL Tight 💪View More
JUST IN: Tether buys 27 tons of gold in Q4 2025, now worth $4,400,000,000.How much you bought last year????

- Reward
- 1
- Comment
- Repost
- Share
Tuesday Jingyi Operation Strategy Analysis
Yellow Hair Continues to Threaten Tariffs on Eight European Countries, Canada, and South Korea. As Safe-Haven Sentiment Rises, Market Opportunities Are Rare
Currently, Bitcoin is oscillating around 88,800 near the transition point between bullish and bearish. ETH is under pressure below 2,950.
Although the rebound after dropping to 86,000 appears strong, trading volume has shrunk, and MACD shows no significant increase. It is recommended to position for a high short at key resistance levels.
Trading Suggestions
Bitcoin: Short around 88,800, add short
View OriginalYellow Hair Continues to Threaten Tariffs on Eight European Countries, Canada, and South Korea. As Safe-Haven Sentiment Rises, Market Opportunities Are Rare
Currently, Bitcoin is oscillating around 88,800 near the transition point between bullish and bearish. ETH is under pressure below 2,950.
Although the rebound after dropping to 86,000 appears strong, trading volume has shrunk, and MACD shows no significant increase. It is recommended to position for a high short at key resistance levels.
Trading Suggestions
Bitcoin: Short around 88,800, add short
- Reward
- 1
- Comment
- Repost
- Share
Eurus
Eurus
Created By@YanyanAngelPromoter
Listing Progress
0.00%
MC:
$3.39K
Create My Token
Precious metals surge masks the strengthening crypto fundamentals, ETH and BTC gains are just a matter of time
140
- Reward
- 1
- 1
- Repost
- Share
Cml1978:
https://www.gate.com/nft/collection/21421/Boga https://www.gate.com/nft/collection/21418/Gate-logo-dragon
https://www.gate.com/nft/collection/21334/Zombi
https://www.gate.com/nft/collection/19167/GATE-NFT-BLUE
The essence of finance: greed + leverage + deferred payment
Finance may seem complex, but if you remove all formulas and models, only three things remain:
1. People want to get something for nothing
2. People overestimate the future
3. People are willing to shift risks onto others
That's why history keeps repeating itself:
Tulip Mania
South Sea Bubble
Railway Stocks
Internet
Real Estate
AI/Crypto
Each cycle has a different slogan, but human nature is exactly the same:
"This time is different."
And the truth is:
Human nature never thinks they are repeating the mistakes others have made.
View OriginalFinance may seem complex, but if you remove all formulas and models, only three things remain:
1. People want to get something for nothing
2. People overestimate the future
3. People are willing to shift risks onto others
That's why history keeps repeating itself:
Tulip Mania
South Sea Bubble
Railway Stocks
Internet
Real Estate
AI/Crypto
Each cycle has a different slogan, but human nature is exactly the same:
"This time is different."
And the truth is:
Human nature never thinks they are repeating the mistakes others have made.

- Reward
- like
- Comment
- Repost
- Share
- Reward
- like
- Comment
- Repost
- Share
Check out Gate and join me in the hottest event! https://www.gate.com/campaigns/3922?ref=VQBAXQ0KAQ&ref_type=132&utm_cmp=HJDbjqnD

- Reward
- 5
- 5
- Repost
- Share
楚老魔:
2026 Go Go Go 👊View More
💥 Gold & Silver Reach New All-Time Highs — A Historic Moment for Precious Metals 💥
Gold and silver have surged to record-breaking levels, marking one of the most significant rallies in precious metals in recent history. As global economic uncertainty deepens and geopolitical tensions rise, investors worldwide are once again turning to safe-haven assets to protect capital and preserve value.
Gold prices have steadily climbed, breaking long-standing resistance levels in international markets. This momentum has been reflected domestically as well, with Pakistan’s local gold rates per tola and p

- Reward
- 4
- 8
- Repost
- Share
MoonGirl:
HODL Tight 💪View More
Load More
Join 40M users in our growing community
⚡️ Join 40M users in the crypto craze discussion
💬 Engage with your favorite top creators
👍 See what interests you
Trending Topics
View More31.24K Popularity
105.87K Popularity
74.07K Popularity
21.14K Popularity
41.25K Popularity
Hot Gate Fun
View More- MC:$3.39KHolders:10.00%
- MC:$3.39KHolders:00.00%
- MC:$3.47KHolders:20.21%
- MC:$3.39KHolders:10.00%
- MC:$3.39KHolders:10.00%
News
View MoreU.S. Ethereum Spot ETF ends 4 consecutive days of net outflows, achieving $117 million in net inflows
14 m
The US Bitcoin spot ETF ends a 5-day streak of net outflows, with a net inflow of $6.8 million yesterday.
16 m
Korean Customs busts counterfeit luxury goods sales case and seizes encrypted assets including Bitcoin
30 m
Vitalik: The difference between state and data lies in editing capability
34 m
On-chain HYPE main long positions generally turn profitable, "suspected HYPE coin listing insider" giant whales still have unrealized losses of $16.6 million
35 m
Pin