BeautifulDay
現在、コンテンツはありません
BeautifulDay
#GENIUSImplementationRulesDraftReleased
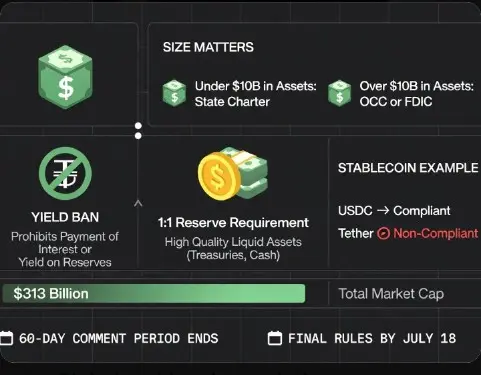
財務省はGENIUS法の実施規則案を公開し、ステーブルコイン業界はこれまでで最も明確にコンプライアンスの意味を理解しました。
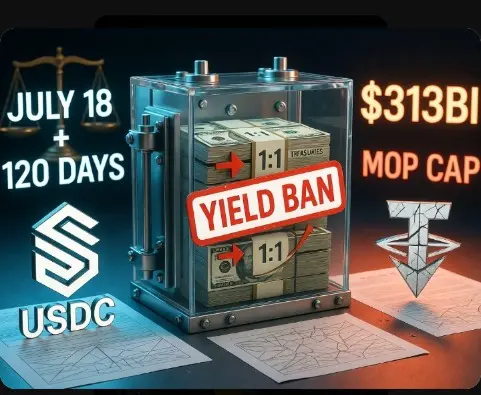
主要なポイントは1:1です。許可された発行者は、ドルに換算して高品質の流動資産(連邦準備銀行の残高、短期国債、適格なマネーマーケットファンド)に準備金を保持しなければなりません。リターンを増やすためにリスクの高い資産を混ぜることは禁じられています。月次の監査済み開示が基本であり、発行量が$50B を超える場合はさらに厳しく監視されます。
利息禁止は、現在の市場構造に最も深く影響を与えるルールです。ステーブルコイン保有者への利息や報酬の支払いは禁止されています。支払いステーブルコインに基づくすべての利息付ステーブルコイン商品は、施行開始前にその構造を見直す必要があります。
担保資産の再担保は禁止されています。準備金はコインを支えるだけで、それ以外のことはしません。
規模によって規制当局が決まります。$10B の未償却発行量が一定以下の場合は州の認可が有効ですが、その州の枠組みが連邦基準と正確に一致し、資本と流動性については基準を満たすか超える必要があります。10億ドル超の場合は、360日以内にOCCまたはFDICの監督下に移行しなければなりません。新たに設立されるステーブルコイン
財務省はGENIUS法の実施規則案を公開し、ステーブルコイン業界はこれまでで最も明確にコンプライアンスの意味を理解しました。
主要なポイントは1:1です。許可された発行者は、ドルに換算して高品質の流動資産(連邦準備銀行の残高、短期国債、適格なマネーマーケットファンド)に準備金を保持しなければなりません。リターンを増やすためにリスクの高い資産を混ぜることは禁じられています。月次の監査済み開示が基本であり、発行量が$50B を超える場合はさらに厳しく監視されます。
利息禁止は、現在の市場構造に最も深く影響を与えるルールです。ステーブルコイン保有者への利息や報酬の支払いは禁止されています。支払いステーブルコインに基づくすべての利息付ステーブルコイン商品は、施行開始前にその構造を見直す必要があります。
担保資産の再担保は禁止されています。準備金はコインを支えるだけで、それ以外のことはしません。
規模によって規制当局が決まります。$10B の未償却発行量が一定以下の場合は州の認可が有効ですが、その州の枠組みが連邦基準と正確に一致し、資本と流動性については基準を満たすか超える必要があります。10億ドル超の場合は、360日以内にOCCまたはFDICの監督下に移行しなければなりません。新たに設立されるステーブルコイン
USDC-0.01%
- 報酬
- 2
- 3
- リポスト
- 共有
StylishKuri:
月へ 🌕もっと見る
#SpaceXSecretlyFilesForIPO
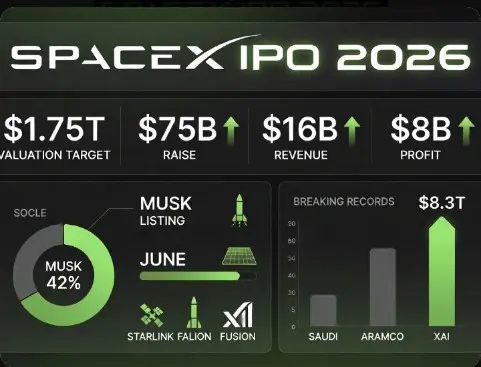
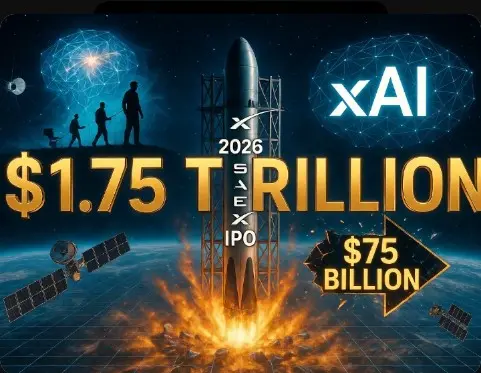
テック業界の最大の秘密がついに公式化されました。SpaceXは2026年4月1日にSECに秘密のS-1を静かに提出し、史上最大のIPOとなる可能性に向けて準備を進めています。
数字だけでも驚異的です。同社は評価額が1.75兆ドルを超えることを目指し、最大$75 十億ドルの資金調達を計画しており、これは2019年のサウジアラムコの$29 十億ドルのデビュー記録を大きく上回るものです。6月の上場も検討されていると報じられています。
これは単なるロケット企業の上場だけではありません。今年初め、SpaceXはマスクのAIベンチャーxAIを株式交換の形で吸収合併し、Starlinkの衛星ブロードバンド帝国、Falcon 9の打ち上げ支配、そしてxAIの人工知能インフラを一つの企業に統合しました。昨年、この統合企業は約$16 十億ドルの収益と$8 十億ドルの利益を上げたと報告されています。IPOは、資本集約型のAI構築と次世代の宇宙インフラ整備、特にマスクが数年以内に世界のAI計算需要を満たす最も安価な方法と考える太陽光発電の軌道データセンターの資金調達を目的としています。
上場が実現すれば、マスクは史上初めて2つの異なる1兆ドル規模の上場企業を同時に率いる人物となります。現在、公開情報によると、彼はSpaceXの約42%を所有しており、
XAI-2.63%
- 報酬
- 3
- 3
- リポスト
- 共有
StylishKuri:
月へ 🌕もっと見る
#StablecoinDebateHeatsUp
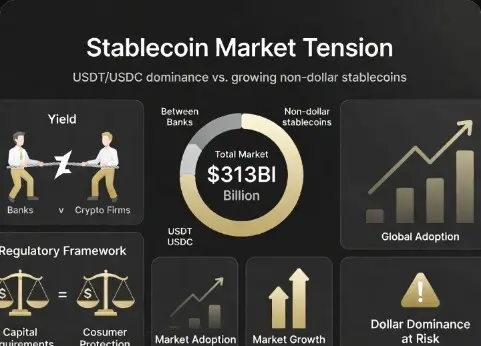
ステーブルコインに関する議論はもはや「もしも」ではなく、「誰がコントロールするか」の問題になっている。
銀行はステーブルコインの保有に対する利回りを制限したいと考えているが、暗号資産企業はオープンな競争を望んでいる。規制当局はその枠組みを構築しつつあるが、両者はまだシステムの将来像について激しく争っている。
GENIUS法案は連邦の監督体制を前進させたものの、依然として未解決の重要な問題が残っている。資本要件、準備金の構成、消費者保護の規定はリアルタイムで定義され続けている。
一方、市場は待っていない。ステーブルコインの供給量は$313 十億を超え、成長はもはやドルだけに依存していない。非ドルのステーブルコインはヨーロッパや東南アジアを中心に拡大しており、多くの場合、逆に規制によって促進されているケースもある。
根底にある緊張はシンプルだが非常に強力だ。
もし銀行が利回りの議論に勝てば、彼らはマージンを守ることができるが、その一方でドル基盤のステーブルコインのグローバルな展開を弱めるリスクも伴う。
逆に負けた場合、新たなタイプの金融機関が形成される。それは銀行のように振る舞い、銀行のように稼ぎながらも、根本的に異なるルールブックの下で運営される組織だ。
この非対称性こそが、真の物語の核心である。
原文表示ステーブルコインに関する議論はもはや「もしも」ではなく、「誰がコントロールするか」の問題になっている。
銀行はステーブルコインの保有に対する利回りを制限したいと考えているが、暗号資産企業はオープンな競争を望んでいる。規制当局はその枠組みを構築しつつあるが、両者はまだシステムの将来像について激しく争っている。
GENIUS法案は連邦の監督体制を前進させたものの、依然として未解決の重要な問題が残っている。資本要件、準備金の構成、消費者保護の規定はリアルタイムで定義され続けている。
一方、市場は待っていない。ステーブルコインの供給量は$313 十億を超え、成長はもはやドルだけに依存していない。非ドルのステーブルコインはヨーロッパや東南アジアを中心に拡大しており、多くの場合、逆に規制によって促進されているケースもある。
根底にある緊張はシンプルだが非常に強力だ。
もし銀行が利回りの議論に勝てば、彼らはマージンを守ることができるが、その一方でドル基盤のステーブルコインのグローバルな展開を弱めるリスクも伴う。
逆に負けた場合、新たなタイプの金融機関が形成される。それは銀行のように振る舞い、銀行のように稼ぎながらも、根本的に異なるルールブックの下で運営される組織だ。
この非対称性こそが、真の物語の核心である。

- 報酬
- 4
- 2
- リポスト
- 共有
StylishKuri:
月へ 🌕もっと見る
#PreciousMetalsPullBackUnderPressure
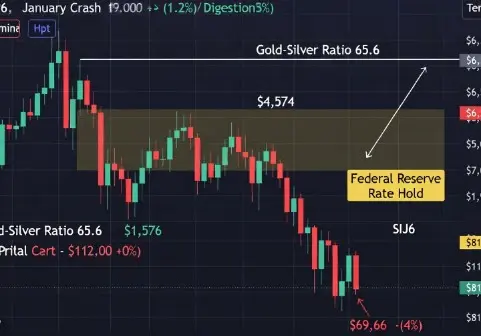
貴金属の調整が圧力下に — 実際に何が起きているのか、そしてなぜ重要なのか
金と銀は暴落しているわけではありません。消化段階にあります。ただし、この調整の背後にある力は、一般的な「安全資産需要の弱まり」という説明よりも正直に理解されるべきです。
現状の状況
2026年4月2日時点で、金先物は1オンスあたり約4,574ドルで取引されており、その日の約1.7%の下落と、1月下旬の高値近くの4,731ドルから下落しています。
銀はより重い圧力にさらされており、4%以上下落しており、1オンスあたり約69.66ドル付近に位置しています。これは1月のピーク95.34ドルを大きく下回っています。
この乖離は驚くべきことではありません。銀はすべてを増幅させます。より激しく上昇し、より大きく調整します。
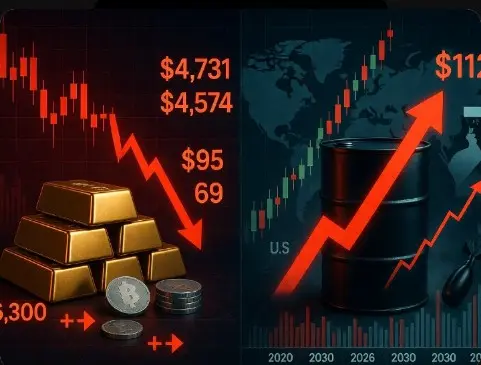
本当の圧力:石油が恐怖取引を吸収
現在最も重要であり、逆説的なダイナミクスは、石油と金属の関係性です。
歴史的に、地政学的緊張は石油と金の両方を押し上げてきました。しかし、2026年にはその関係性が崩れています。
4月2日に米国のイランに対するレトリックが高まると、石油は急騰し、ブレント原油は112ドル超で取引されました。一方、金はそれに追随せず、急落しました。
変わったのは金の役割ではなく、パニック資本の行き先です。
現在
原文表示貴金属の調整が圧力下に — 実際に何が起きているのか、そしてなぜ重要なのか
金と銀は暴落しているわけではありません。消化段階にあります。ただし、この調整の背後にある力は、一般的な「安全資産需要の弱まり」という説明よりも正直に理解されるべきです。
現状の状況
2026年4月2日時点で、金先物は1オンスあたり約4,574ドルで取引されており、その日の約1.7%の下落と、1月下旬の高値近くの4,731ドルから下落しています。
銀はより重い圧力にさらされており、4%以上下落しており、1オンスあたり約69.66ドル付近に位置しています。これは1月のピーク95.34ドルを大きく下回っています。
この乖離は驚くべきことではありません。銀はすべてを増幅させます。より激しく上昇し、より大きく調整します。
本当の圧力:石油が恐怖取引を吸収
現在最も重要であり、逆説的なダイナミクスは、石油と金属の関係性です。
歴史的に、地政学的緊張は石油と金の両方を押し上げてきました。しかし、2026年にはその関係性が崩れています。
4月2日に米国のイランに対するレトリックが高まると、石油は急騰し、ブレント原油は112ドル超で取引されました。一方、金はそれに追随せず、急落しました。
変わったのは金の役割ではなく、パニック資本の行き先です。
現在
- 報酬
- 2
- 3
- リポスト
- 共有
StylishKuri:
月へ 🌕もっと見る
#CeasefireExpectationsRise
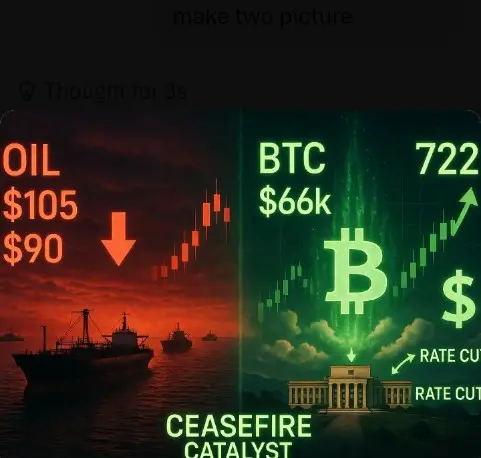
現在のマクロ背景は、2026年サイクルにおいて暗号資産(クリプト)が直面した中で最も重要な展開の一つであり、停戦の物語がその中心に位置しています。
実際に重要なメカニズム
米国とイランの対立は、暗号資産に直接的な影響を与えませんでした。それは石油を通じて暗号資産に影響を及ぼしました。
世界の石油流通の約20%がホルムズ海峡を通っています。そのルートに圧力がかかると、石油価格はバレルあたり$105 ドルを超え、連鎖反応を引き起こしました:インフレ期待は高止まりし、連邦準備制度の利下げ確率はゼロに近づき、ドルは強化され、リスク資産から流動性が流出しました。
この連鎖が、BTCをローカル高値から$65,000–$66,000の範囲に押し下げました。また、これが2026年第1四半期を2018年以来最悪の四半期にした理由でもあります。
信頼できる停戦が実現すれば、センチメントの改善だけでなく、その一連の流れを逆転させることができます—もしそれが維持されれば。
市場が実際に織り込んでいるもの
市場は停戦そのものを織り込んでいるのではなく、その確率を織り込んでいます。
この違いは重要です。
トランプ大統領の4月1日の演説は、ホルムズ海峡の再開と紛争の正式な終結を切り離すことで、物語の流れを変えました。市場にとってこれは非常に重要です。石油供
原文表示現在のマクロ背景は、2026年サイクルにおいて暗号資産(クリプト)が直面した中で最も重要な展開の一つであり、停戦の物語がその中心に位置しています。
実際に重要なメカニズム
米国とイランの対立は、暗号資産に直接的な影響を与えませんでした。それは石油を通じて暗号資産に影響を及ぼしました。
世界の石油流通の約20%がホルムズ海峡を通っています。そのルートに圧力がかかると、石油価格はバレルあたり$105 ドルを超え、連鎖反応を引き起こしました:インフレ期待は高止まりし、連邦準備制度の利下げ確率はゼロに近づき、ドルは強化され、リスク資産から流動性が流出しました。
この連鎖が、BTCをローカル高値から$65,000–$66,000の範囲に押し下げました。また、これが2026年第1四半期を2018年以来最悪の四半期にした理由でもあります。
信頼できる停戦が実現すれば、センチメントの改善だけでなく、その一連の流れを逆転させることができます—もしそれが維持されれば。
市場が実際に織り込んでいるもの
市場は停戦そのものを織り込んでいるのではなく、その確率を織り込んでいます。
この違いは重要です。
トランプ大統領の4月1日の演説は、ホルムズ海峡の再開と紛争の正式な終結を切り離すことで、物語の流れを変えました。市場にとってこれは非常に重要です。石油供
- 報酬
- 2
- 4
- リポスト
- 共有
StylishKuri:
月へ 🌕もっと見る
ビットコインが69,000ドルをテスト、1.85%上昇
50 件のリマインダーを設定しました
2026-04-02 15:40
- 報酬
- 1
- 3
- リポスト
- 共有
SheenCrypto :
:
LFG 🔥もっと見る
#OilPricesRise
現在石油市場で展開されているのは、通常のコモディティの上昇ではありません。これは、世界的な影響をもたらす構造的なショックです。
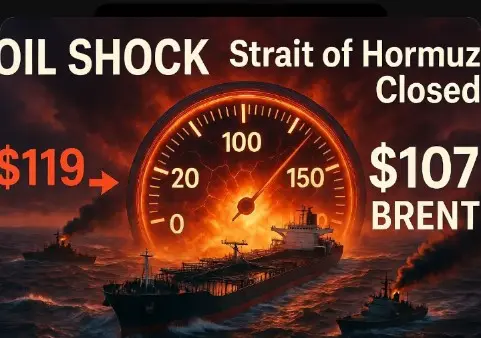
ブレント原油は4月2日に$107 を超え、WTIは$106に迫っています。これは1セッションで6%の動きであり、年初来で約42%の上昇です。わずか3か月で、石油は$73 からピークの約$119.50まで急騰し、その後$104–$107 の範囲で安定しています。
その推進力は一つだけです:米国とイランの対立がホルムズ海峡を実質的に閉鎖したことです。これは、世界の石油供給の約20%、LNG輸送のほぼ30%を占める重要な航路です。これは仮想的な混乱ではありません。現在進行中であり、解決の明確な期限はありません。
解決を価格に反映できない市場
この状況は、以前の石油ショックよりも構造的に複雑です。
イランはホルムズの再開に対して影響力を持ち、米国の指導層はその結果をもって対立の終結を結びつけています。これは循環依存の関係です:再開は解決に依存し、解決は再開に依存しています。市場はそのようなループを価格付けできません。
たとえ明日ホルムズ海峡が再開されたとしても、正常化は即座には起こりません。船舶の遅れを解消し、流れを再ルートし、製油所のスケジュールを安定させるには、6〜8週間かかると航運関係者は見積もっています。エネルギーシステムは
原文表示現在石油市場で展開されているのは、通常のコモディティの上昇ではありません。これは、世界的な影響をもたらす構造的なショックです。
ブレント原油は4月2日に$107 を超え、WTIは$106に迫っています。これは1セッションで6%の動きであり、年初来で約42%の上昇です。わずか3か月で、石油は$73 からピークの約$119.50まで急騰し、その後$104–$107 の範囲で安定しています。
その推進力は一つだけです:米国とイランの対立がホルムズ海峡を実質的に閉鎖したことです。これは、世界の石油供給の約20%、LNG輸送のほぼ30%を占める重要な航路です。これは仮想的な混乱ではありません。現在進行中であり、解決の明確な期限はありません。
解決を価格に反映できない市場
この状況は、以前の石油ショックよりも構造的に複雑です。
イランはホルムズの再開に対して影響力を持ち、米国の指導層はその結果をもって対立の終結を結びつけています。これは循環依存の関係です:再開は解決に依存し、解決は再開に依存しています。市場はそのようなループを価格付けできません。
たとえ明日ホルムズ海峡が再開されたとしても、正常化は即座には起こりません。船舶の遅れを解消し、流れを再ルートし、製油所のスケジュールを安定させるには、6〜8週間かかると航運関係者は見積もっています。エネルギーシステムは
- 報酬
- 5
- 6
- リポスト
- 共有
StylishKuri:
月へ 🌕もっと見る
ビットコインが69,000ドルをテスト、1.85%上昇
112回再生
2026-04-02 15:08
終了済み • リプレイなし
- 報酬
- いいね
- コメント
- リポスト
- 共有
#CryptoMarketSeesVolatility
市場はもはや単なるボラティリティではありません。それは、半減期サイクルを通じて市場を支えた楽観主義を体系的に剥ぎ取っている最中であり、そのダメージは一時的ではなく構造的なものに見え始めています。
マクロの締め付け
「解放の日」と銘打たれた1年後、関税枠組みはコストを引き上げただけではありません。アメリカの例外主義の核心となる物語を侵食しています — それは株式、クレジット、暗号資産のリスク志向を支えた同じ物語です。
最高裁判所の2月の広範な関税権限に対する判決は何も解決しませんでした。既存の貿易摩擦に法的曖昧さを加えただけです。市場は曖昧さを価格に反映させず、割引きます。
BTCは現在、半減後のピークから約23%下落しており、2026年第1四半期は2018年以来最も弱い半減後の四半期となっています。その比較は重要です。2018年は調整局面ではなく、長期的な弱気サイクルの始まりでした。
同時に、地政学的圧力は緩んでいません。イラン関連の動きはリスクセンチメントに持続的な重しをかけ続けています。資本はそれに反応し、金は新高値に向かって押し上げられる一方、BTCは漂っています。18ヶ月前なら、その乖離は無視されていたでしょう。今では、それが確認となっています。
数字が実際に示すもの
BTCは66,766ドルで取引されており、24時
原文表示市場はもはや単なるボラティリティではありません。それは、半減期サイクルを通じて市場を支えた楽観主義を体系的に剥ぎ取っている最中であり、そのダメージは一時的ではなく構造的なものに見え始めています。
マクロの締め付け
「解放の日」と銘打たれた1年後、関税枠組みはコストを引き上げただけではありません。アメリカの例外主義の核心となる物語を侵食しています — それは株式、クレジット、暗号資産のリスク志向を支えた同じ物語です。
最高裁判所の2月の広範な関税権限に対する判決は何も解決しませんでした。既存の貿易摩擦に法的曖昧さを加えただけです。市場は曖昧さを価格に反映させず、割引きます。
BTCは現在、半減後のピークから約23%下落しており、2026年第1四半期は2018年以来最も弱い半減後の四半期となっています。その比較は重要です。2018年は調整局面ではなく、長期的な弱気サイクルの始まりでした。
同時に、地政学的圧力は緩んでいません。イラン関連の動きはリスクセンチメントに持続的な重しをかけ続けています。資本はそれに反応し、金は新高値に向かって押し上げられる一方、BTCは漂っています。18ヶ月前なら、その乖離は無視されていたでしょう。今では、それが確認となっています。
数字が実際に示すもの
BTCは66,766ドルで取引されており、24時
- 報酬
- 6
- 5
- リポスト
- 共有
ybaser:
To The Moon 🌕To The Moon 🌕To The Moon 🌕もっと見る
#GateSquareAprilPostingChallenge
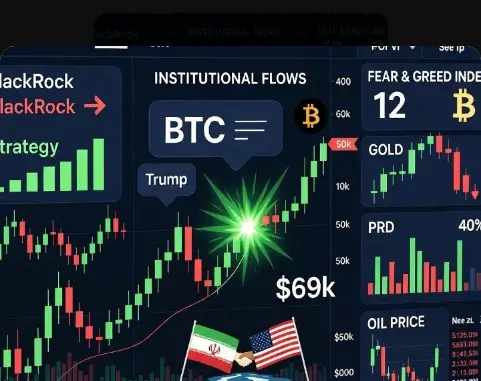
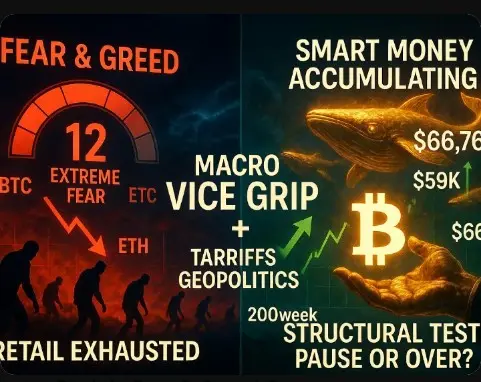
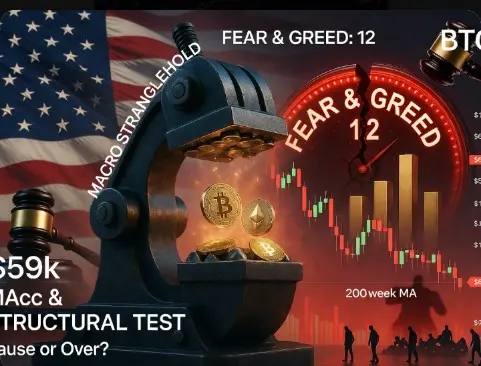
恐怖と貪欲指数は12です。30ではなく、20でもなく、12です。
そのレベルは歴史的に二つのことを示しています:いずれかは投げ売りの底値…またはより深い下落の始まりです。今のところ、市場はどちらになりたいのか決めかねている状態です。
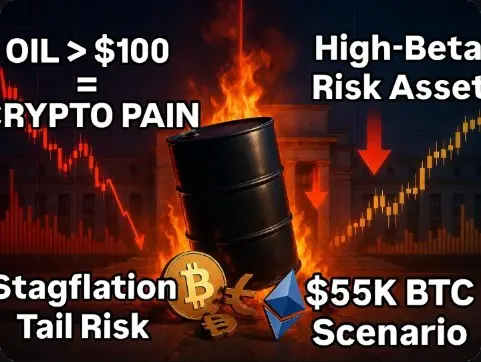
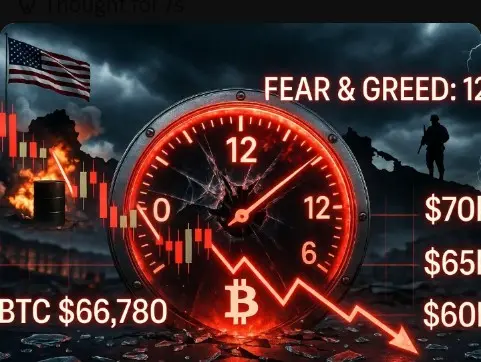
BTCは66,780ドルで取引されており、2.47%下落しています。ETHは2,056ドルで、3.14%下落しています。これらの動きは単体では管理可能ですが、現在のマクロ経済状況に重ねて考えると、多くのトレーダーが認識している以上の重みを持っています。
同時に展開しているのは以下の状況です:
トランプ大統領がイランとの軍事衝突について国民に演説しました。石油は即座に100ドルを超えました。同じ時間帯にBTCも下落しています。これはリアルタイムの相関関係の議論であり、その答えは明白です。地政学的リスクオフの状況では、BTCは安全資産ではなくハイベータリスク資産のように振る舞います。この区別は、今のポジションサイズにとって重要です。
同時に、Solana上のDrift Protocolは、耐久性のあるノンスを用いた高度に調整された管理者キーの妥協による$280M exploitを受けました。これは典型的なスマートコントラクトのバグではありませんでした。数週間の準備の
原文表示恐怖と貪欲指数は12です。30ではなく、20でもなく、12です。
そのレベルは歴史的に二つのことを示しています:いずれかは投げ売りの底値…またはより深い下落の始まりです。今のところ、市場はどちらになりたいのか決めかねている状態です。
BTCは66,780ドルで取引されており、2.47%下落しています。ETHは2,056ドルで、3.14%下落しています。これらの動きは単体では管理可能ですが、現在のマクロ経済状況に重ねて考えると、多くのトレーダーが認識している以上の重みを持っています。
同時に展開しているのは以下の状況です:
トランプ大統領がイランとの軍事衝突について国民に演説しました。石油は即座に100ドルを超えました。同じ時間帯にBTCも下落しています。これはリアルタイムの相関関係の議論であり、その答えは明白です。地政学的リスクオフの状況では、BTCは安全資産ではなくハイベータリスク資産のように振る舞います。この区別は、今のポジションサイズにとって重要です。
同時に、Solana上のDrift Protocolは、耐久性のあるノンスを用いた高度に調整された管理者キーの妥協による$280M exploitを受けました。これは典型的なスマートコントラクトのバグではありませんでした。数週間の準備の
- 報酬
- 3
- 4
- リポスト
- 共有
StylishKuri:
月へ 🌕もっと見る
#StablecoinDebateHeatsUp
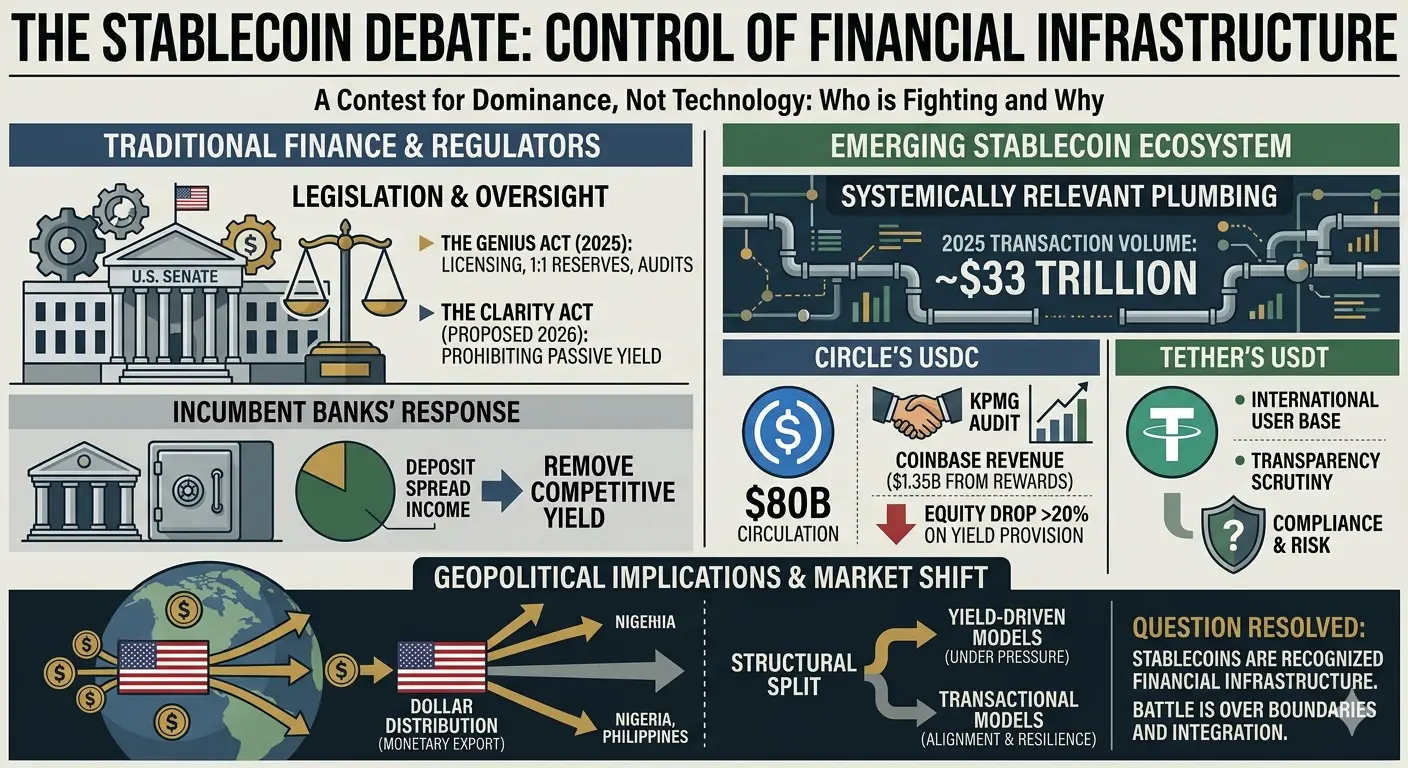
ステーブルコインの議論は技術の問題ではありません。これは金融インフラの支配権を巡る争いであり、誰が戦っているのか、なぜ戦っているのかを正確に理解する価値があります。
数字はその賭けの規模を示しています。ドルにペッグされたステーブルコインは2025年におよそ$33 兆ドルの取引量を処理しました。もはや暗号通貨の一部のニッチな領域ではありません。これはシステム的に重要な配管であり、従来の金融と並行して運用されており、ワシントンもついにその視点を調整しました。
立法の状況はその変化を反映しています。
2025年7月に成立したGENIUS法は、最初の持続可能な連邦枠組みを確立しました。これにより、1:1の準備金 backing、義務的な監査、発行者のライセンス要件が課されました。長らく準備金の透明性を巡る監視対象だったテザーは、KPMGと提携してUSDTの完全監査を行うことでその立場を正式化しました。CircleのUSDCは約$80 十億ドルの流通量に達しました。一見、業界は求めていた正当性を確保した形です。規制の明確さに基づく正当性です。
Clarity Actは、そのトーンを一変させます。
2026年3月末時点の上院の修正案には、「ステーブルコインを単に保有することに対して“直接または間接的”な報酬を禁止する」条項が含まれています。実
USDC-0.01%
- 報酬
- 3
- 4
- リポスト
- 共有
StylishKuri:
月へ 🌕もっと見る
#USStocksRebound
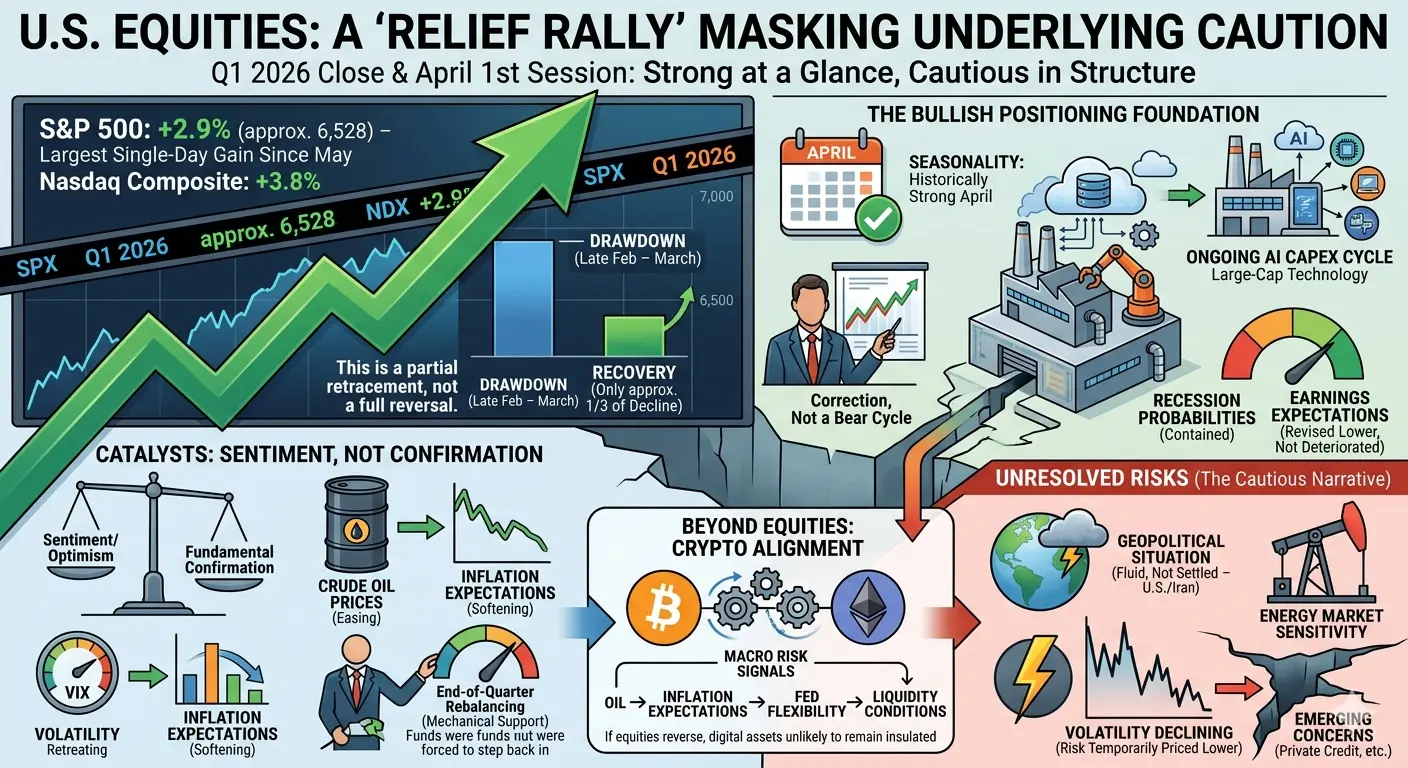
米国株式市場は2026年第1四半期の終わりと4月の最初のセッションにかけて反発していますが、一見すると強い動きに見えますが、その根底にある構造はより慎重な見方を示しています。
S&P 500は5月以来最大の1日上昇を記録し、約2.9%上昇して6,528近くで取引を終えました。ナスダック総合指数は約3.8%の上昇でこれを上回りました。動きの強さにもかかわらず、この反発は2月下旬から始まった下落の約3分の1程度しか回復していません。文脈としては、これは完全な反転ではなく、既存の下落局面内での部分的なリトレースメントです。
この動きのきっかけはセンチメントであり、確認ではありませんでした。米国とイランの紛争の緊張緩和の可能性に対する楽観的な見方が原油価格を下げ、それがインフレ期待の緩和につながりました。この変化は重要です。なぜなら、高騰したエネルギー価格は、連邦準備制度の長期的な引き締め政策への懸念を強めていたからです。原油価格が下がるとともに、ボラティリティの期待も和らぎ、VIXは最近の高値から後退しました。同時に、機関投資家のポジショニングも影響しました。四半期末のリバランスにより、過去5週間の売りで株式エクスポージャーを減らしていたファンドが再び市場に戻り、価格を機械的に支えました。
強気のポジショニングには根拠があります。季節性は4月を好む傾向
原文表示米国株式市場は2026年第1四半期の終わりと4月の最初のセッションにかけて反発していますが、一見すると強い動きに見えますが、その根底にある構造はより慎重な見方を示しています。
S&P 500は5月以来最大の1日上昇を記録し、約2.9%上昇して6,528近くで取引を終えました。ナスダック総合指数は約3.8%の上昇でこれを上回りました。動きの強さにもかかわらず、この反発は2月下旬から始まった下落の約3分の1程度しか回復していません。文脈としては、これは完全な反転ではなく、既存の下落局面内での部分的なリトレースメントです。
この動きのきっかけはセンチメントであり、確認ではありませんでした。米国とイランの紛争の緊張緩和の可能性に対する楽観的な見方が原油価格を下げ、それがインフレ期待の緩和につながりました。この変化は重要です。なぜなら、高騰したエネルギー価格は、連邦準備制度の長期的な引き締め政策への懸念を強めていたからです。原油価格が下がるとともに、ボラティリティの期待も和らぎ、VIXは最近の高値から後退しました。同時に、機関投資家のポジショニングも影響しました。四半期末のリバランスにより、過去5週間の売りで株式エクスポージャーを減らしていたファンドが再び市場に戻り、価格を機械的に支えました。
強気のポジショニングには根拠があります。季節性は4月を好む傾向
- 報酬
- 6
- 7
- リポスト
- 共有
StylishKuri:
月へ 🌕もっと見る
#TrumpSignalsPossibleCeasefire
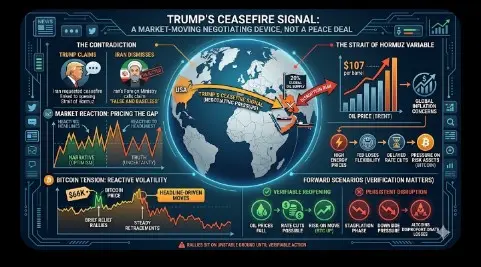
トランプの停戦シグナルは平和合意ではありません。それは交渉の手段であり — 活発な紛争に投じられた圧力戦術であり — 市場は解決の認識に反応しているだけであり、実際の解決には反応していません。
今週の状況は矛盾によって定義されています。トランプは公に、イランの新しい指導部がホルムズ海峡の全面再開に結びついた停戦を要請したと主張しました。数時間以内に、イランの外務省はその主張を「虚偽かつ根拠のないもの」と否定しました。その乖離こそがシグナルです:一方は意図を投影し、もう一方はそれを完全に拒否しています。市場はナarrativeと真実の間のギャップを価格付けしています。
ホルムズ海峡は依然として中心的な変数です。世界の石油供給の約20%がそこを通っています。その妨害はすでにブレント原油を$107 ドル以上に押し上げ、世界的にインフレ懸念を再燃させています。これはもはや地政学的な問題だけではなく、金融政策に直接的な制約をもたらしています。エネルギー価格が高止まりする限り、中央銀行、特に連邦準備制度は柔軟性を失います。利下げは遅れ、リスク資産はその圧力を引き継ぎます。
ビットコインはこの緊張を明確に反映しています。価格は$66K付近を推移しており、最近の高値から大きく下落しています。パターンは予測可能になっています:緊張緩和の
BTC-2.07%
- 報酬
- 4
- 5
- リポスト
- 共有
Yunna:
月へ 🌕もっと見る
#ClaudeCode500KCodeLeak
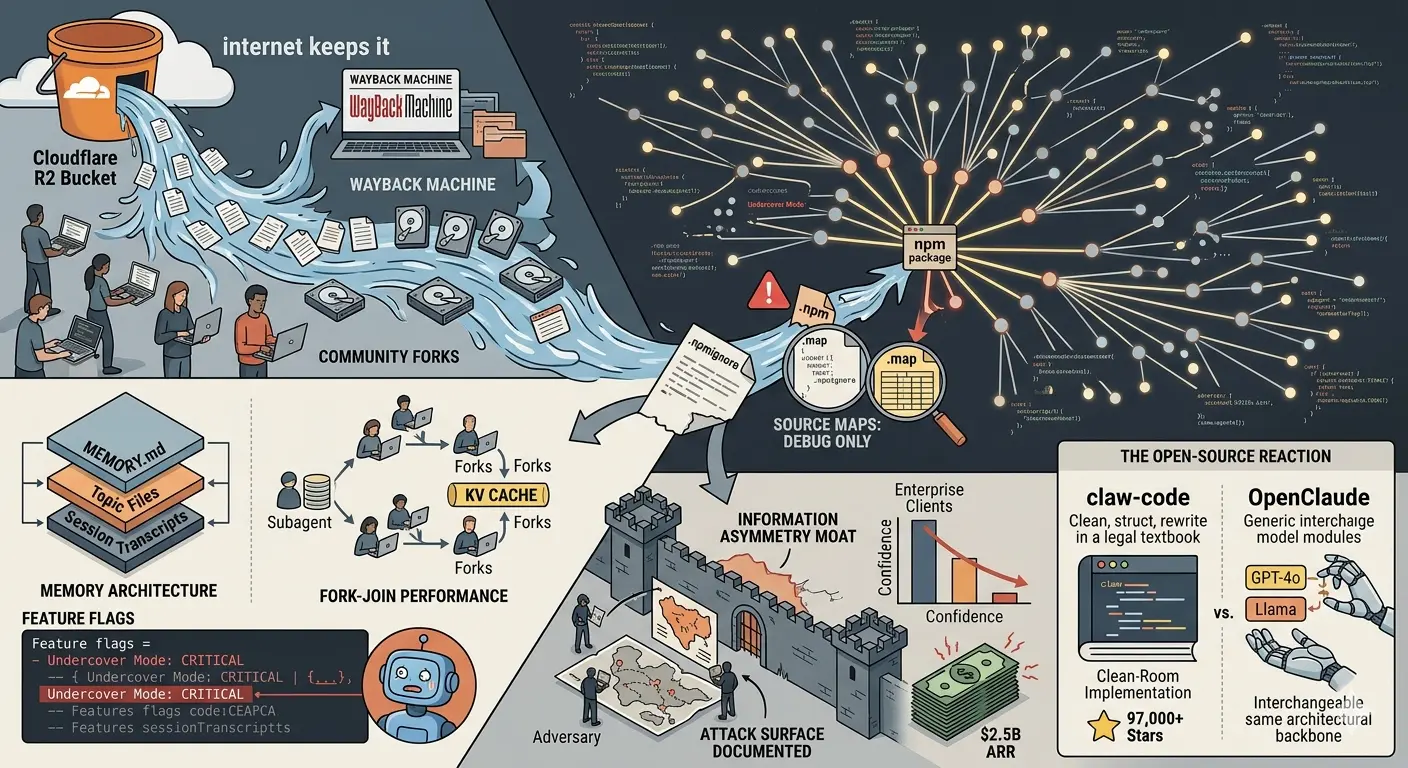
2026年3月31日、Anthropicは意図せずに512,000行以上の独自のTypeScriptコードを公開インターネットに露出させてしまった。
原因は複雑ではなかった。運用上のミスだった。
.minファイルを復元するために使用されるデバッグアーティファクトの.mapファイルが、Claude Code npmパッケージの定期的な更新時に .npmignore で除外されていなかった。運用環境ではソースマップは決して出荷されないが、今回はそうなってしまった。
このファイルは、パッケージのメタデータに埋め込まれたCloudflare R2バケットのリンクからアクセス可能だった。数時間以内に、セキュリティ研究者のChaofan Shouが特定し、共有した。この投稿は何千万もの目に触れ、何千もの開発者がリポジトリをフォークした後、削除作業が始まった。
AnthropicがGitHubから何千ものコピーを削除した時点では、コードはすでにアーカイブされ、ミラーリングされ、管轄区域を超えて配布されていた。もはや封じ込めは不可能だった。
重要なのは漏洩そのものではなく、それが明らかにしたことだ。
公開されたコードは、Claude CodeがTypeScriptで構築されたCLIベースのエージェントとして動作し、Bun
原文表示2026年3月31日、Anthropicは意図せずに512,000行以上の独自のTypeScriptコードを公開インターネットに露出させてしまった。
原因は複雑ではなかった。運用上のミスだった。
.minファイルを復元するために使用されるデバッグアーティファクトの.mapファイルが、Claude Code npmパッケージの定期的な更新時に .npmignore で除外されていなかった。運用環境ではソースマップは決して出荷されないが、今回はそうなってしまった。
このファイルは、パッケージのメタデータに埋め込まれたCloudflare R2バケットのリンクからアクセス可能だった。数時間以内に、セキュリティ研究者のChaofan Shouが特定し、共有した。この投稿は何千万もの目に触れ、何千もの開発者がリポジトリをフォークした後、削除作業が始まった。
AnthropicがGitHubから何千ものコピーを削除した時点では、コードはすでにアーカイブされ、ミラーリングされ、管轄区域を超えて配布されていた。もはや封じ込めは不可能だった。
重要なのは漏洩そのものではなく、それが明らかにしたことだ。
公開されたコードは、Claude CodeがTypeScriptで構築されたCLIベースのエージェントとして動作し、Bun
- 報酬
- 7
- 4
- 1
- 共有
Yunna:
LFG 🔥もっと見る
#GoldSilverRally
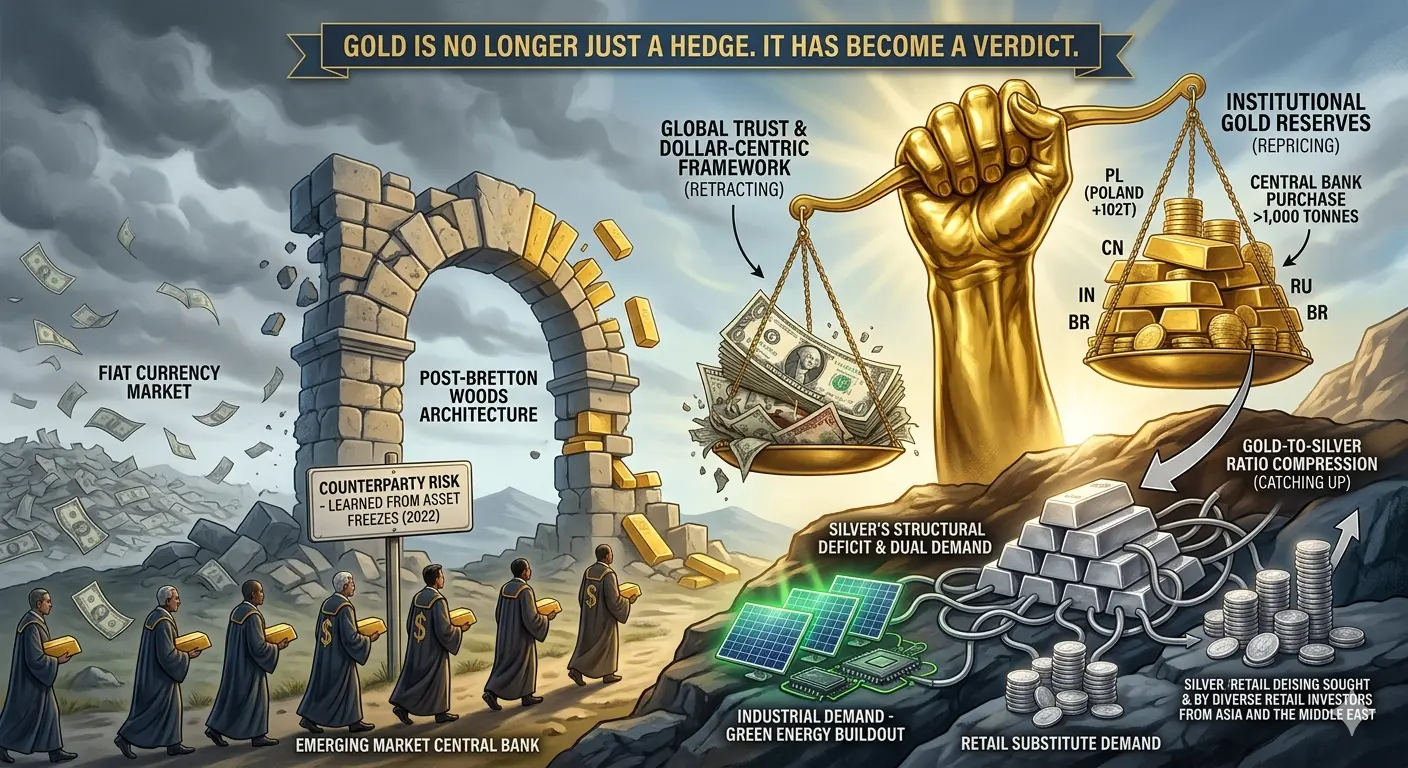
金はもはや単なるヘッジではなくなった。これは判決である。
金が約$3,000から2025年までに$3,700超のピークに達し、その後40日以内に一時的に$4,000の閾値に触れたとき、市場は単にインフレやドルの弱体化に反応していたわけではない。それは世界的な信頼の構造全体を再評価しているのだ。世界中の中央銀行は3年連続で1,000トン以上の金を購入した。ポーランドだけでも102トンを追加し、その金の比率を総準備の約30%に近づけている。これらはパニック的な動きではない。これは、ポストブレトン・ウッズ体制のドル中心の枠組みが静かに解体されつつあることを示す機関的な宣言であり、一トンずつ進行している。
このラリーに埋め込まれたデデドル化のシグナルは、最も過小評価されている要素である。2022年に米国がロシアの主権資産を凍結したとき、それはすべての新興市場の中央銀行に対して、カウンターパーティリスクの実例を生きた形で示した。メッセージはゆっくりと、そして一気に浸透した。発行体もカウンターパーティも政治的管轄権も持たない金は、論理的な行き先となった。見た目は貴金属の取引に見えるが、実際には地政学的なリザーブの再配分がスローモーションで進行しているのだ。
銀の物語は構造的に異なり、多くの点でより説得力がある。2025年は、世界的な銀供給不足の5年連続を記録
原文表示

- 報酬
- 5
- 8
- リポスト
- 共有
Yunna:
LFG 🔥もっと見る
#CryptoMarketsRiseBroadly
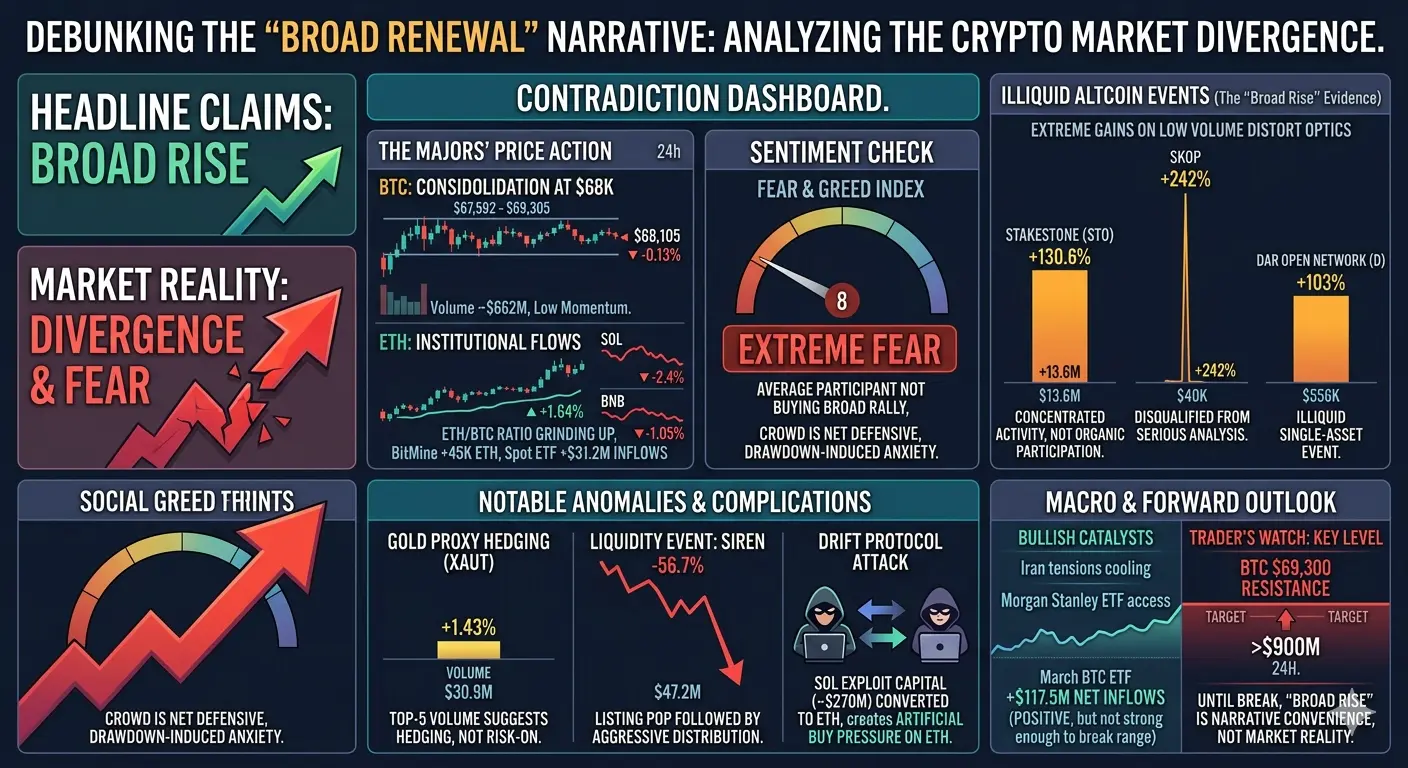
BTCは68,105ドルに位置し、24時間変動率は-0.13%です。ETHは2,139ドルで1.64%上昇しています。SOLは2.4%下落。BNBも1.05%下落しています。現在推進されている広範な市場のストーリーは、主要銘柄の価格動向と一致していません。実際に起きているのは、市場の一部が激しく動いたことであり、そのストーリーは正直に語る価値があります。
恐怖と強欲指数は100点中8点を示しており、これは極度の恐怖状態を意味し、強気相場ではありません。これは平均的な参加者がこの全体的なラリーを買いと捉えていないことを示しています。市場参加者は防御的な姿勢を取り、今起きている価格上昇は、多くの保有者が未だに損失による不安に座している中で起こっているものであり、新たな楽観ではありません。
「広範な上昇」ストーリーの証拠はアルトコインの層に見られます。StakeStone (STO)は24時間で130.6%上昇し、取引量は1,360万ドルを超え、トップ10に入りました。これはこの時価総額レベルのトークンにとって、自然な市場参加ではなく集中した方向性のある活動を示しています。SKOPは242%上昇しましたが、取引量はわずか40,000ドルであり、真剣な分析には不適格です。Dar Open Network (D)は103%上昇し、取引量は
原文表示BTCは68,105ドルに位置し、24時間変動率は-0.13%です。ETHは2,139ドルで1.64%上昇しています。SOLは2.4%下落。BNBも1.05%下落しています。現在推進されている広範な市場のストーリーは、主要銘柄の価格動向と一致していません。実際に起きているのは、市場の一部が激しく動いたことであり、そのストーリーは正直に語る価値があります。
恐怖と強欲指数は100点中8点を示しており、これは極度の恐怖状態を意味し、強気相場ではありません。これは平均的な参加者がこの全体的なラリーを買いと捉えていないことを示しています。市場参加者は防御的な姿勢を取り、今起きている価格上昇は、多くの保有者が未だに損失による不安に座している中で起こっているものであり、新たな楽観ではありません。
「広範な上昇」ストーリーの証拠はアルトコインの層に見られます。StakeStone (STO)は24時間で130.6%上昇し、取引量は1,360万ドルを超え、トップ10に入りました。これはこの時価総額レベルのトークンにとって、自然な市場参加ではなく集中した方向性のある活動を示しています。SKOPは242%上昇しましたが、取引量はわずか40,000ドルであり、真剣な分析には不適格です。Dar Open Network (D)は103%上昇し、取引量は
- 報酬
- 8
- 8
- リポスト
- 共有
Yunna:
LFG 🔥もっと見る